
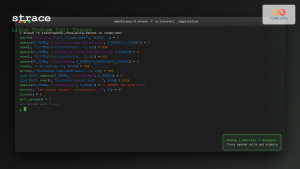
strace is one of the most powerful debugging and diagnostic tools available in Linux systems. It allows you to trace system calls made by programs, providing invaluable insights into how applications interact with the kernel. This comprehensive guide will take you from basic concepts to advanced strace techniques.
What is strace?
strace is a diagnostic, debugging, and instructional userspace utility that monitors and tampers with interactions between processes and the Linux kernel. It intercepts and records the system calls made by a process and the signals received by that process.
Key Benefits of Using strace
- Debug application issues without source code access
- Monitor file system interactions and network operations
- Analyze performance bottlenecks at the system call level
- Understand program behavior and dependencies
- Troubleshoot permission problems and missing files
Installing strace
Most Linux distributions include strace by default. If not installed, use your package manager:
# Ubuntu/Debian
sudo apt-get install strace

# CentOS/RHEL/Fedora
sudo yum install strace
# or
sudo dnf install strace

# Arch Linux
sudo pacman -S strace
Basic strace Syntax and Usage
The basic syntax for strace is:
strace [options] command [args]
strace [options] -p pid
Simple strace Example
Let’s start with a basic example tracing the ls command:
strace ls /homeThis produces output like:
execve("/bin/ls", ["ls", "/home"], 0x7ffce8f9c8c0 /* 24 vars */) = 0
brk(NULL)                               = 0x55f8a9b7b000
arch_prctl(ARCH_SET_FS, 0x7f8b2c9c4540) = 0
readlink("/proc/self/exe", "/bin/ls", 4096) = 7
access("/etc/ld.so.preload", R_OK)      = -1 ENOENT (No such file or directory)
openat(AT_FDCWD, "/etc/ld.so.cache", O_RDONLY|O_CLOEXEC) = 3
fstat(3, {st_mode=S_IFREG|0644, st_size=27454, ...}) = 0
mmap(NULL, 27454, PROT_READ, MAP_PRIVATE, 3, 0) = 0x7f8b2c9bd000
close(3)                                = 0
openat(AT_FDCWD, "/lib/x86_64-linux-gnu/libselinux.so.1", O_RDONLY|O_CLOEXEC) = 3
Advanced strace Options
Filtering System Calls
Use the -e option to filter specific system calls:
# Trace only file operations
strace -e trace=file ls /home

# Trace only network operations
strace -e trace=network curl google.com

# Trace specific system calls
strace -e trace=open,read,write cat /etc/passwd
Following Child Processes
Use -f to follow fork() calls and trace child processes:
strace -f bash -c "ls | wc -l"Attaching to Running Processes
Attach strace to an already running process using its PID:
# Find the process ID
ps aux | grep nginx

# Attach to the process
sudo strace -p 1234
Advanced Filtering and Output Control
Time-based Analysis
Add timestamps and duration information:
# Show absolute timestamps
strace -t ls /home

# Show timestamps with microseconds
strace -tt ls /home

# Show time spent in each system call
strace -T ls /home
Example output with timing:
09:15:23.456789 openat(AT_FDCWD, "/home", O_RDONLY|O_NONBLOCK|O_CLOEXEC|O_DIRECTORY) = 3 <0.000015>
09:15:23.456820 fstat(3, {st_mode=S_IFDIR|0755, st_size=4096, ...}) = 0 <0.000008>
09:15:23.456845 getdents64(3, /* 5 entries */, 32768) = 144 <0.000012>
Advanced Filtering Examples
# Trace file system operations excluding successful calls
strace -e trace=file -e status=failed ls /nonexistent

# Trace memory operations
strace -e trace=memory ./my_application

# Trace process management
strace -e trace=process systemctl status nginx

# Trace IPC operations
strace -e trace=ipc ./shared_memory_app
Debugging Real-World Scenarios
Scenario 1: Debugging File Access Issues
When an application fails to find a configuration file:
strace -e trace=file,desc -o debug.log ./myapp 2>&1Sample output showing the issue:
openat(AT_FDCWD, "/etc/myapp/config.conf", O_RDONLY) = -1 ENOENT (No such file or directory)
openat(AT_FDCWD, "/usr/local/etc/myapp.conf", O_RDONLY) = -1 ENOENT (No such file or directory)
openat(AT_FDCWD, "/home/user/.myapp/config", O_RDONLY) = 3
Scenario 2: Network Debugging
Trace network operations for a web server:
sudo strace -e trace=network -p $(pgrep nginx | head -1)This reveals socket operations, connection attempts, and data transfers:
accept4(6, {sa_family=AF_INET, sin_port=htons(54321), sin_addr=inet_addr("192.168.1.100")}, [16], SOCK_CLOEXEC) = 7
read(7, "GET / HTTP/1.1\r\nHost: example.com\r\n", 4096) = 38
write(7, "HTTP/1.1 200 OK\r\nContent-Length: 612\r\n", 40) = 40
Scenario 3: Performance Analysis
Identify slow system calls using statistical summary:
strace -c ./performance_test_appOutput shows system call statistics:
% time     seconds  usecs/call     calls    errors syscall
------ ----------- ----------- --------- --------- ----------------
 45.67    0.002134          47        45           read
 23.45    0.001096          36        30           write
 15.23    0.000712          89         8           open
  8.91    0.000417          52         8           close
  6.74    0.000315          39         8           fstat
------ ----------- ----------- --------- --------- ----------------
100.00    0.004674                   99           total
Advanced strace Techniques
Custom Output Formatting
Control output verbosity and format:
# Limit string output length
strace -s 128 cat large_file.txt

# Show instruction pointer
strace -i ls /home

# Decode signal numbers
strace -e signal=all kill -9 1234
Multi-process Debugging
Debug complex applications with multiple processes:
# Follow all child processes and show PIDs
strace -f -ff -o trace_output. ./multi_process_app

# This creates separate files: trace_output.1234, trace_output.1235, etc.
System Call Injection and Modification
Advanced users can inject faults to test error handling:
# Inject failures into open() system calls
strace -e fault=open:error=ENOENT ./myapp
Interpreting strace Output
Understanding System Call Format
Each line follows this pattern:
syscall_name(arguments) = return_value [error_description] <duration>Common System Calls and Their Meanings
| System Call | Purpose | Example |
|---|---|---|
openat() |
Open files | openat(AT_FDCWD, "/etc/passwd", O_RDONLY) = 3 |
read() |
Read data | read(3, "root:x:0:0:root:/root:/bin/bash\n", 4096) = 32 |
write() |
Write data | write(1, "Hello World\n", 12) = 12 |
mmap() |
Memory mapping | mmap(NULL, 4096, PROT_READ|PROT_WRITE, MAP_PRIVATE|MAP_ANONYMOUS, -1, 0) |
socket() |
Create socket | socket(AF_INET, SOCK_STREAM, IPPROTO_TCP) = 4 |
Practical strace Scripts and Automation
Monitoring File Access Patterns
#!/bin/bash
# Monitor file access for a specific application
APP_NAME="myapp"
OUTPUT_FILE="file_access_$(date +%Y%m%d_%H%M%S).log"

strace -e trace=file -o "$OUTPUT_FILE" -f "$APP_NAME" &
STRACE_PID=$!

echo "Monitoring $APP_NAME file access. Press Ctrl+C to stop."
trap "kill $STRACE_PID 2>/dev/null; echo 'Monitoring stopped.'" INT

wait $STRACE_PID
echo "File access log saved to $OUTPUT_FILE"
Performance Bottleneck Detection
#!/bin/bash
# Identify slow system calls
THRESHOLD_MS=100  # Calls taking longer than 100ms

strace -T -o temp_trace.log "$@"

echo "System calls taking longer than ${THRESHOLD_MS}ms:"
awk -v threshold=$((THRESHOLD_MS * 1000)) '
    /<[0-9]+\.[0-9]+>/ {
        match($0, /<([0-9]+\.[0-9]+)>/, time)
        if (time[1] * 1000000 > threshold) {
            print $0
        }
    }
' temp_trace.log

rm temp_trace.log
Security Considerations
Permissions and Access
strace requires appropriate permissions:
- Root privileges for tracing system processes
- Same user for tracing user processes
- ptrace capabilities may be restricted by security policies
Sensitive Data Exposure
Be cautious when tracing applications that handle sensitive data:
# Avoid logging sensitive system calls
strace -e trace=!read,write secure_app

# Use file output with restricted permissions
strace -o /tmp/trace.log chmod 600 /tmp/trace.log; ./app
Best Practices and Tips
Performance Considerations
- Filter system calls to reduce overhead and noise
- Use statistical mode (-c) for performance analysis
- Limit string length (-s) for better performance
- Write to files (-o) instead of terminal for large outputs
Troubleshooting Common Issues
# Handle "Operation not permitted" errors
echo 0 | sudo tee /proc/sys/kernel/yama/ptrace_scope

# Trace setuid programs
sudo strace -u username setuid_program

# Debug dynamic linking issues
strace -e trace=file ld.so --list program
Integration with Other Tools
Combining strace with Other Utilities
# Use with grep for specific patterns
strace ls 2>&1 | grep -E "(ENOENT|EACCES)"

# Combine with awk for statistical analysis
strace -T program 2>&1 | awk '/<[0-9]/ {print $NF}' | sort -n

# Use with watch for continuous monitoring
watch -n 1 'strace -p $(pgrep myapp) -c -e trace=file'
Alternative Tools and Comparisons
| Tool | Purpose | When to Use |
|---|---|---|
ltrace |
Library call tracing | Debugging library interactions |
perf |
Performance profiling | CPU performance analysis |
gdb |
Source-level debugging | When source code is available |
valgrind |
Memory debugging | Memory leak detection |
Conclusion
strace is an indispensable tool for Linux system administrators, developers, and security professionals. Its ability to provide deep insights into system call behavior makes it invaluable for debugging, performance analysis, and security auditing. By mastering the advanced techniques covered in this guide, you’ll be able to diagnose complex system issues, optimize application performance, and understand the intricate details of how programs interact with the Linux kernel.
Remember to use strace responsibly, especially in production environments, as it can impact system performance. Start with filtered traces and gradually expand your scope as needed. With practice, strace will become an essential part of your Linux troubleshooting toolkit.
Related Posts
strace Command Linux: Complete Guide to System Call Tracing and Debugging
The strace command is one of the most powerful debugging and monitoring tools available in Linux systems. It allows you...
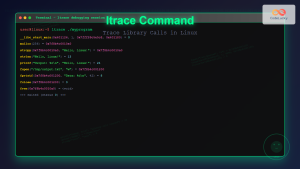
ltrace Command Linux: Complete Guide to Trace Library Calls and Debug Programs
The ltrace command is a powerful debugging and analysis tool in Linux that allows you to trace library calls made...
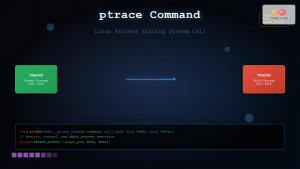
ptrace Command Linux: Complete Guide to Process Tracing System Call
The ptrace system call is one of Linux's most powerful tools for process monitoring and debugging. It allows one process...
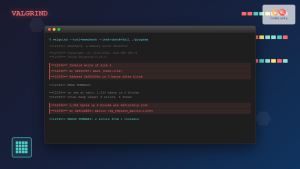
valgrind Command Linux: Complete Memory Debugging and Profiling Guide
Valgrind is one of the most powerful and essential tools for Linux developers and system administrators who need to debug...
perf Command Linux: Complete Performance Analysis and Profiling Guide
The perf command is one of the most powerful performance analysis tools available in Linux, offering comprehensive insights into system...
Core Dump Linux: Complete Guide to Debug Program Crashes and Memory Issues
A core dump is a crucial debugging tool in Linux that captures the complete memory state of a program at...
gcore Command Linux: Complete Guide to Generate Core Dump Files for Debugging
The gcore command in Linux is a powerful debugging tool that generates core dump files from running processes without terminating...
Process in Operating System: Complete Guide to Definition, States and Lifecycle
What is a Process in Operating System? A process is a program in execution that consists of the program code...
debugfs Command Linux: Complete Guide to Debug Ext2/3/4 Filesystems
The debugfs command is a powerful interactive filesystem debugger for ext2, ext3, and ext4 filesystems in Linux. It provides low-level...
htop Command Linux: Complete Guide to Advanced Process Monitoring and Management
The htop command is an enhanced, interactive version of the traditional top command that provides real-time monitoring of system processes...
gdb Command Linux: Complete GNU Debugger Tutorial for Developers
The GNU Debugger (GDB) is one of the most powerful and essential tools for developers working on Linux systems. As...
dmesg Command Linux: Complete Guide to Display and Analyze Kernel Messages
The dmesg command is one of the most powerful diagnostic tools in Linux, providing administrators and users with direct access...


