Market volatility is one of the most fundamental—and often misunderstood—aspects of the stock market. It represents how frequently and dramatically stock prices move over a specific period. Volatility is not inherently bad; it’s a measure of the level of uncertainty or risk in the market. Both traders and investors study volatility closely to make informed decisions about entry points, hedging strategies, and overall portfolio risk management.
What Is Market Volatility?
In simple terms, volatility measures how much prices move up or down. A highly volatile market means prices swing quickly and unpredictably, while a low-volatility market experiences more stable, gradual price changes. Typically, the variance or standard deviation of returns is used to quantify volatility.
For example, if a stock’s price moves from ₹100 to ₹120 and back to ₹100 in a week, its volatility is high. If another stock stays around ₹105 with minor daily changes, its volatility is low. Both situations offer opportunities, but the former carries higher risk and potential reward.
Why Volatility Happens
Volatility is driven by a combination of factors, including:
- Market sentiment: Fear and greed can amplify price movements.
- Economic news: Interest rate changes, inflation reports, or GDP data may trigger strong reactions.
- Earnings results: Company performance reports often cause sharp moves.
- Global events: Political instability, wars, or pandemics increase uncertainty.
- Liquidity shifts: When fewer buyers or sellers exist, prices move more rapidly.
How Volatility Is Measured
One of the most common indicators is the VIX Index (Volatility Index), often referred to as the market’s “fear gauge.” It reflects expected volatility over the next 30 days for the S&P 500 index. Higher VIX levels usually indicate greater fear and uncertainty.

In addition to VIX, traders may calculate historical volatility based on actual price movements over time. Quantitative investors often use these metrics to decide whether to enter, hedge, or avoid a position.
Types of Volatility
- Historical Volatility (HV): The actual recorded fluctuation of prices over past data points.
- Implied Volatility (IV): Derived from option prices, reflecting the market’s expectation of future movement.
- Intraday Volatility: Observed within a single trading session, useful for scalpers and day traders.

The Relationship Between Volatility and Risk
Volatility is not synonymous with loss—it’s a measure of potential fluctuation. High volatility means prices can move both up and down sharply. Long-term investors often view temporary volatility as an opportunity to accumulate assets at discounted prices, while short-term traders may see it as a signal for potential profit or loss.
For instance, during the 2020 market crash triggered by pandemic fears, volatility surged dramatically. Long-term investors who held quality stocks through that period eventually benefited from price recoveries, highlighting the distinction between short-term risk and long-term reward.
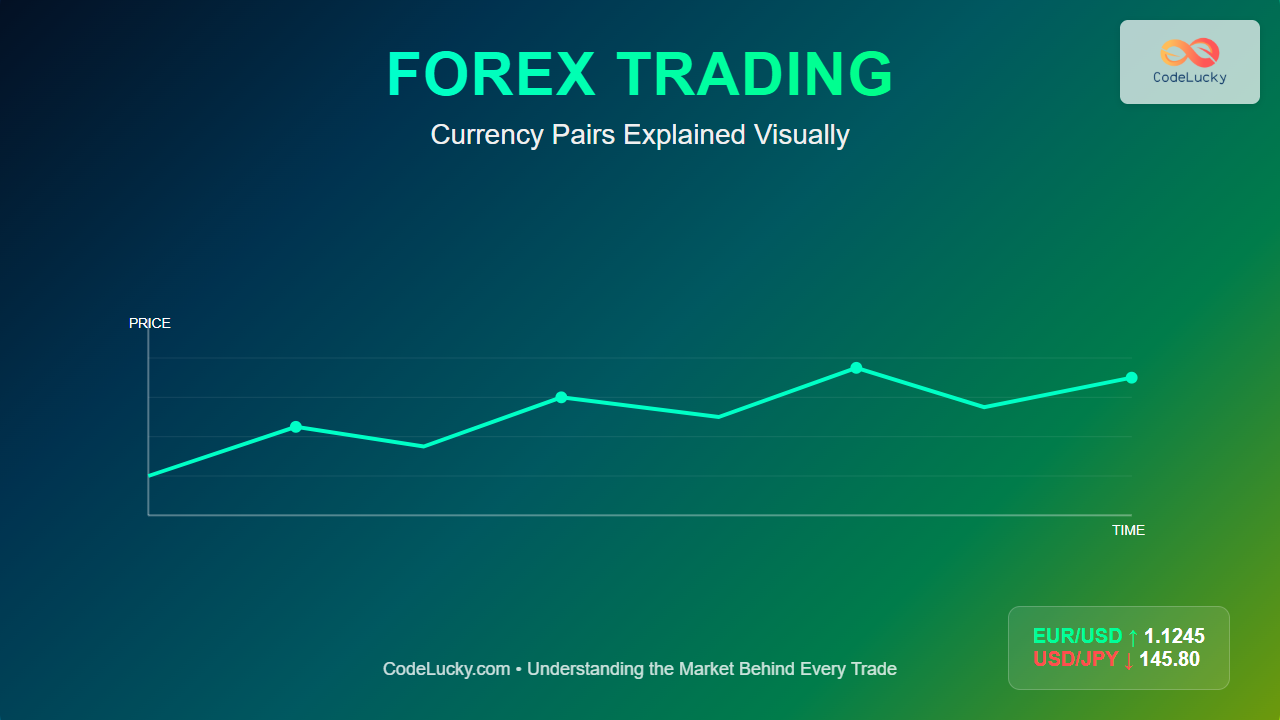
Visualizing Market Volatility Over Time
The following mermaid line chart shows how a hypothetical stock might behave during different market conditions:
As seen above, the “Volatile Market” line fluctuates more dramatically in both directions compared to the “Stable Market.”
Volatility Clustering and Psychological Impact
Volatility often comes in waves, a behavior known as volatility clustering. Markets alternate between calm and turbulent periods rather than moving randomly. This aligns with human psychology—fear spreads quickly during downturns, amplifying the effect.

Managing Volatility as an Investor
Managing volatility means balancing risk and reward. Here are a few strategies used by investors and traders alike:
- Diversification: Spread investments across sectors, markets, and asset classes to reduce exposure to sudden moves.
- Hedging: Use options or futures to offset potential losses in your primary holdings.
- Staggered investing: Adopt dollar-cost averaging to reduce the emotional burden of timing the market.
- Focus on fundamentals: Look beyond temporary price swings and evaluate company strength and cash flow.
- Maintain liquidity: Keep some portion in cash to take advantage of market dips.

Volatility in Different Market Phases
Volatility behaves differently across bull and bear markets:
| Market Phase | Typical Volatility | Common Investor Emotion | Examples |
|---|---|---|---|
| Bull Market | Low to moderate | Optimism, confidence | Post-2016 equity run |
| Bear Market | High | Fear, capitulation | Global Financial Crisis (2008) |
| Recovery Phase | Moderate | Cautious optimism | After 2020 pandemic dip |
Interactive Example: Simulate Volatility
You can simulate market volatility interactively using JavaScript or browser console. Try running the following pseudo-example locally to visualize random price movements:
// Simple volatility simulation
let price = 100;
for(let i = 0; i < 10; i++){
  price += (Math.random() - 0.5) * 10;
  console.log("Day", i+1, "Price:", price.toFixed(2));
}
This script prints fluctuating prices that mimic real-world volatility.
Final Thoughts
Volatility is the heartbeat of the stock market—it creates opportunities and risks. Understanding what drives market volatility helps investors stay calm during turbulent times and align strategies with their risk tolerance and investment goals. Whether you’re a day trader or a long-term investor, learning to interpret volatility is key to making smarter, data-driven decisions.
Article by CodeLucky.com – Empowering Readers with Clear, Practical Finance Insights.