
SolarWinds Network Performance Monitor (NPM) is a powerful network monitoring solution that provides comprehensive visibility into network infrastructure performance. While traditionally associated with Windows environments, SolarWinds has expanded its capabilities to support Linux-based monitoring, making it an excellent choice for mixed environments and Linux-centric organizations.
What is SolarWinds Network Performance Monitor?
SolarWinds NPM is an enterprise-grade network monitoring tool that offers real-time network performance monitoring, fault detection, and capacity planning capabilities. It uses SNMP (Simple Network Management Protocol) to collect data from network devices and provides detailed insights into network health, bandwidth utilization, and device performance.
Key Features for Linux Environments
- SNMP-based monitoring for Linux servers and network devices
- Custom Linux application monitoring with specialized templates
- Network topology discovery and mapping
- Bandwidth analysis and capacity planning
- Real-time alerting and notification system
- Historical reporting and trend analysis
Installing SolarWinds NPM on Linux
While SolarWinds NPM server typically runs on Windows, you can monitor Linux systems and deploy monitoring agents on Linux machines. Here’s how to set up Linux monitoring:
Prerequisites
# Update your Linux system
sudo apt update && sudo apt upgrade -y  # For Debian/Ubuntu
sudo yum update -y                       # For RHEL/CentOS

# Install SNMP daemon
sudo apt install snmpd snmp-mibs-downloader  # Debian/Ubuntu
sudo yum install net-snmp net-snmp-utils     # RHEL/CentOS

# Install monitoring dependencies
sudo apt install curl wget net-tools
Configuring SNMP on Linux
First, configure SNMP daemon to allow monitoring:
# Edit SNMP configuration
sudo nano /etc/snmp/snmpd.conf

# Add these configurations:
# Community string (change 'public' to your preferred string)
rocommunity public localhost
rocommunity public 192.168.1.0/24  # Your network range

# System information
syslocation "Data Center - Linux Server"
syscontact "[email protected]"

# Access control
view systemonly included .1.3.6.1.2.1.1
view systemonly included .1.3.6.1.2.1.25.1
access notConfigGroup "" any noauth exact systemonly none none

# Restart SNMP service
sudo systemctl restart snmpd
sudo systemctl enable snmpd
Testing SNMP Configuration
# Test SNMP locally
snmpwalk -v2c -c public localhost 1.3.6.1.2.1.1.1.0

# Expected output:
# SNMPv2-MIB::sysDescr.0 = STRING: Linux hostname 5.4.0-74-generic #83-Ubuntu SMP Sat May 8 02:35:39 UTC 2021 x86_64

# Test from remote machine
snmpwalk -v2c -c public [LINUX_SERVER_IP] 1.3.6.1.2.1.1.1.0
Setting Up Linux Monitoring in SolarWinds NPM
Adding Linux Nodes
Once your SolarWinds NPM server is ready, follow these steps to add Linux systems:
- Open SolarWinds Web Console
- Navigate to Settings → Manage Nodes
- Click “Add Node”
- Enter Linux server details:
- IP Address or Hostname
- SNMP Community String
- SNMP Version (typically v2c)
Configuring Linux-Specific Monitoring
# Create custom application monitor script
#!/bin/bash
# linux_monitor.sh - Custom Linux monitoring script

# CPU Usage
CPU_USAGE=$(top -bn1 | grep "Cpu(s)" | awk '{print $2}' | awk -F'%' '{print $1}')

# Memory Usage
MEMORY_USAGE=$(free | grep Mem | awk '{printf "%.2f", ($3/$2) * 100.0}')

# Disk Usage
DISK_USAGE=$(df -h / | awk 'NR==2 {print $5}' | sed 's/%//')

# Network Interface Status
NETWORK_STATUS=$(ip link show | grep "state UP" | wc -l)

# Log to monitoring file
echo "$(date): CPU=${CPU_USAGE}%, MEM=${MEMORY_USAGE}%, DISK=${DISK_USAGE}%, NET_UP=${NETWORK_STATUS}" >> /var/log/system_monitor.log

# Send SNMP traps (optional)
snmptrap -v2c -c public localhost '' 1.3.6.1.4.1.12345.1 \
  1.3.6.1.4.1.12345.1.1 s "CPU_Usage" \
  1.3.6.1.4.1.12345.1.2 s "${CPU_USAGE}"
Linux-Specific Monitoring Templates
Creating Custom Linux Application Monitor
SolarWinds NPM allows you to create custom application monitors for Linux services:
# Create service monitoring script
#!/bin/bash
# service_monitor.sh

SERVICES=("apache2" "mysql" "ssh" "nginx")

for service in "${SERVICES[@]}"; do
    if systemctl is-active --quiet $service; then
        echo "$service: RUNNING"
        # Send success SNMP trap
        snmptrap -v2c -c public localhost '' 1.3.6.1.4.1.12345.2 \
          1.3.6.1.4.1.12345.2.1 s "$service" \
          1.3.6.1.4.1.12345.2.2 s "UP"
    else
        echo "$service: DOWN"
        # Send alert SNMP trap
        snmptrap -v2c -c public localhost '' 1.3.6.1.4.1.12345.2 \
          1.3.6.1.4.1.12345.2.1 s "$service" \
          1.3.6.1.4.1.12345.2.2 s "DOWN"
    fi
done
Configure Cron Job for Automated Monitoring
# Edit crontab
crontab -e

# Add monitoring jobs
# Run system monitoring every 5 minutes
*/5 * * * * /usr/local/bin/linux_monitor.sh

# Check services every minute
* * * * * /usr/local/bin/service_monitor.sh

# Verify cron jobs
crontab -l
Network Performance Monitoring Commands
Essential Linux Commands for Network Monitoring
# Network interface statistics
cat /proc/net/dev

# Example output:
# Interface statistics:
#  eth0: 1234567890 123456 0 0 0 0 0 0 987654321 98765 0 0 0 0 0 0

# Network connections
netstat -tuln | head -10

# Active TCP/UDP connections
ss -tuln

# Bandwidth monitoring with iftop (install first: sudo apt install iftop)
sudo iftop -i eth0

# Network latency testing
ping -c 4 8.8.8.8

# Traceroute to destination
traceroute google.com

# DNS lookup performance
nslookup google.com
dig google.com
Advanced Network Performance Analysis
# Install network analysis tools
sudo apt install iftop nethogs nload vnstat

# Real-time bandwidth usage by process
sudo nethogs eth0

# Network load visualization
nload eth0

# Historical network statistics
vnstat -i eth0

# TCP connection analysis
ss -i | grep tcp

# Network buffer analysis
cat /proc/net/sockstat
Configuring Alerts and Thresholds
Setting Up Linux-Specific Alerts
Configure alerts in SolarWinds NPM for Linux-specific metrics:
# Create alert threshold script
#!/bin/bash
# alert_thresholds.sh

# CPU threshold (90%)
CPU_THRESHOLD=90
CURRENT_CPU=$(top -bn1 | grep "Cpu(s)" | awk '{print $2}' | awk -F'%' '{print $1}' | cut -d'.' -f1)

if [ "$CURRENT_CPU" -gt "$CPU_THRESHOLD" ]; then
    echo "ALERT: CPU usage is ${CURRENT_CPU}% (threshold: ${CPU_THRESHOLD}%)"
    # Send email alert
    echo "High CPU usage on $(hostname): ${CURRENT_CPU}%" | mail -s "CPU Alert" [email protected]
fi

# Memory threshold (85%)
MEMORY_THRESHOLD=85
CURRENT_MEMORY=$(free | grep Mem | awk '{printf "%.0f", ($3/$2) * 100.0}')

if [ "$CURRENT_MEMORY" -gt "$MEMORY_THRESHOLD" ]; then
    echo "ALERT: Memory usage is ${CURRENT_MEMORY}% (threshold: ${MEMORY_THRESHOLD}%)"
fi

# Disk space threshold (90%)
DISK_THRESHOLD=90
CURRENT_DISK=$(df -h / | awk 'NR==2 {print $5}' | sed 's/%//')

if [ "$CURRENT_DISK" -gt "$DISK_THRESHOLD" ]; then
    echo "ALERT: Disk usage is ${CURRENT_DISK}% (threshold: ${DISK_THRESHOLD}%)"
fi
Performance Optimization Tips
Optimizing SNMP Performance
# Optimize SNMP configuration for performance
sudo nano /etc/snmp/snmpd.conf

# Add performance optimizations:
# Reduce timeout values
defaultsecuritymodel v2c
timeout 5
retries 3

# Optimize MIB loading
mibs +ALL
mibdirs +/usr/share/snmp/mibs

# Configure logging
logoption ef
logfile /var/log/snmpd.log

# Restart service
sudo systemctl restart snmpd
System Performance Tuning
# Network performance tuning
echo 'net.core.rmem_max = 16777216' >> /etc/sysctl.conf
echo 'net.core.wmem_max = 16777216' >> /etc/sysctl.conf
echo 'net.ipv4.tcp_rmem = 4096 32768 16777216' >> /etc/sysctl.conf
echo 'net.ipv4.tcp_wmem = 4096 32768 16777216' >> /etc/sysctl.conf

# Apply changes
sudo sysctl -p

# Verify changes
sysctl net.core.rmem_max
sysctl net.core.wmem_max
Troubleshooting Common Issues
SNMP Connection Problems
# Check SNMP daemon status
sudo systemctl status snmpd

# Test SNMP connectivity
snmpget -v2c -c public localhost 1.3.6.1.2.1.1.1.0

# Check firewall settings
sudo ufw status
sudo iptables -L | grep 161

# Allow SNMP through firewall
sudo ufw allow 161/udp
sudo iptables -A INPUT -p udp --dport 161 -j ACCEPT
Performance Issues
# Monitor system resources
top -b -n1 | head -20
iostat -x 1 5
vmstat 1 5

# Check network interface errors
cat /proc/net/dev | grep -E "(eth0|ens|enp)"

# Analyze log files
tail -f /var/log/syslog
journalctl -u snmpd -f
Best Practices for Linux Network Monitoring
Security Considerations
- Use SNMPv3 for enhanced security with authentication and encryption
- Restrict SNMP access to specific IP addresses or subnets
- Change default community strings from ‘public’ to custom values
- Regular security updates for monitoring tools and dependencies
Performance Best Practices
- Monitor polling intervals to avoid overwhelming systems
- Use appropriate SNMP versions based on requirements
- Implement proper data retention policies
- Regular maintenance of monitoring databases
Advanced Monitoring Scenarios
Container Monitoring
# Docker container monitoring
#!/bin/bash
# docker_monitor.sh

# List running containers
RUNNING_CONTAINERS=$(docker ps --format "table {{.Names}}\t{{.Status}}" | grep -c "Up")

# Container resource usage
docker stats --no-stream --format "table {{.Container}}\t{{.CPUPerc}}\t{{.MemUsage}}\t{{.NetIO}}"

# Monitor specific container
CONTAINER_NAME="nginx"
CONTAINER_CPU=$(docker stats --no-stream --format "{{.CPUPerc}}" $CONTAINER_NAME | sed 's/%//')

if [ $(echo "$CONTAINER_CPU > 80" | bc) -eq 1 ]; then
    echo "ALERT: Container $CONTAINER_NAME CPU usage is ${CONTAINER_CPU}%"
fi
Kubernetes Monitoring
# Kubernetes cluster monitoring
kubectl get nodes
kubectl get pods --all-namespaces
kubectl top nodes
kubectl top pods --all-namespaces

# Monitor specific namespace
kubectl get events --namespace=production --sort-by='.lastTimestamp'
Integration with Other Tools
SolarWinds NPM can be integrated with other monitoring solutions commonly used in Linux environments:
- Nagios – For complementary service monitoring
- Zabbix – For additional metrics collection
- Grafana – For advanced visualization
- ELK Stack – For log analysis and correlation
Conclusion
SolarWinds Network Performance Monitor provides comprehensive network monitoring capabilities for Linux environments. By properly configuring SNMP, setting up custom monitoring scripts, and following best practices, you can achieve excellent visibility into your Linux network infrastructure. The combination of real-time monitoring, historical analysis, and proactive alerting makes SolarWinds NPM a valuable tool for Linux system administrators.
Regular maintenance, security updates, and performance optimization ensure that your monitoring solution continues to provide accurate and reliable network performance insights. Remember to adapt the monitoring configuration to your specific environment and requirements for optimal results.
Related Posts
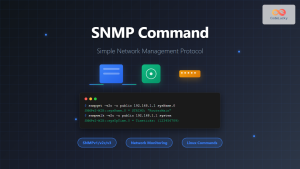
SNMP Command Linux: Complete Guide to Simple Network Management Protocol Configuration and Usage
Introduction to SNMP Command in Linux Simple Network Management Protocol (SNMP) is a fundamental protocol used for monitoring and managing...

ManageEngine Linux: Complete Network Monitoring Solutions Guide
Network monitoring is crucial for maintaining optimal performance and security in Linux environments. ManageEngine provides powerful network monitoring solutions specifically...

Zenoss Linux: Complete Guide to IT Infrastructure Monitoring and Management
What is Zenoss and Why Use it on Linux? Zenoss is a powerful, open-source IT infrastructure monitoring platform that provides...

observium Linux: Complete Network Management and Monitoring Platform Guide
Observium is a powerful, auto-discovering network monitoring platform designed for Linux systems that provides comprehensive visibility into network infrastructure. This...

whatsup Linux: Complete Network Monitoring and System Administration Guide
whatsup is a powerful network monitoring and system administration tool for Linux that provides real-time insights into network connectivity, system...
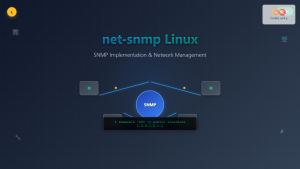
net-snmp Linux: Complete Guide to SNMP Implementation and Management
Simple Network Management Protocol (SNMP) is a cornerstone of network management, and net-snmp is the most widely used open-source implementation...

Paessler Linux: Complete Guide to Network Monitoring with PRTG on Linux Systems
Network monitoring is crucial for maintaining optimal performance and security in Linux environments. Paessler PRTG Network Monitor offers comprehensive monitoring...

intermapper Linux: Complete Network Monitoring and Mapping Guide
What is InterMapper for Linux? InterMapper is a powerful network monitoring and mapping tool that provides real-time visibility into network...

Spiceworks Linux: Complete Network Monitoring and Management Guide
Spiceworks is a powerful, free IT network monitoring and management platform that has revolutionized how system administrators handle their infrastructure....

Cacti Advanced Linux: Complete Guide to Enterprise Network Graphing and Monitoring
Cacti stands as one of the most powerful open-source network graphing solutions available for Linux systems, providing comprehensive network monitoring...
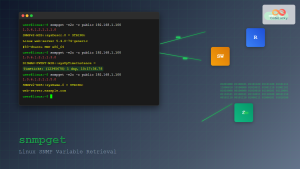
snmpget Command Linux: Complete Guide to Retrieving SNMP Variables
The snmpget command is a powerful Linux utility that allows network administrators to retrieve specific SNMP (Simple Network Management Protocol)...

LibreNMS Linux: Complete Network Monitoring System Setup and Configuration Guide
LibreNMS is a powerful, open-source network monitoring platform that provides comprehensive visibility into network infrastructure. Built on PHP and MySQL,...


