
The slurm command is a powerful network monitoring tool for Linux systems that provides real-time visualization of network traffic and bandwidth utilization. This command-line utility displays network interface statistics in an easy-to-read format, making it an essential tool for system administrators and network engineers who need to monitor network performance and troubleshoot connectivity issues.
What is slurm Command?
slurm (Simple Linux Utility for Resource Management – though this name can be confused with the job scheduler, the network monitoring tool is different) is a lightweight network interface monitor that displays real-time network statistics for Linux systems. It provides detailed information about network traffic, including bytes transferred, packets sent/received, and transfer rates for each network interface.
Key Features of slurm
- Real-time monitoring: Displays live network traffic statistics
- Multiple interface support: Monitors all available network interfaces simultaneously
- Color-coded output: Uses colors to differentiate between different types of data
- Lightweight: Minimal system resource usage
- Configurable display: Customizable refresh rates and display options
Installing slurm
Before using slurm, you need to install it on your Linux system. The installation process varies depending on your distribution:
Ubuntu/Debian Systems
sudo apt update
sudo apt install slurm
Red Hat/CentOS/Fedora Systems
# For RHEL/CentOS with EPEL repository
sudo yum install epel-release
sudo yum install slurm

# For Fedora
sudo dnf install slurm
Arch Linux
sudo pacman -S slurmBasic slurm Syntax
The basic syntax for the slurm command is:
slurm [OPTIONS] [INTERFACE]Where:
OPTIONSare various command-line flags to modify behaviorINTERFACEis the specific network interface to monitor (optional)
Common slurm Options and Flags
| Option | Description |
|---|---|
-i |
Specify network interface to monitor |
-d |
Set delay between updates (in seconds) |
-c |
Use color output (default) |
-s |
Sort interfaces by traffic volume |
-l |
Use line mode (single line per interface) |
-h |
Display help information |
-v |
Show version information |
Practical Examples
Example 1: Basic Network Monitoring
To start monitoring all network interfaces with default settings:
slurmSample Output:
Interface: eth0
RX: 15.2 KB/s (128 packets/s)
TX: 8.7 KB/s (94 packets/s)
Total RX: 2.3 GB
Total TX: 1.8 GB

Interface: lo
RX: 0.0 KB/s (0 packets/s)
TX: 0.0 KB/s (0 packets/s)
Total RX: 45.2 KB
Total TX: 45.2 KB
Example 2: Monitor Specific Interface
To monitor a specific network interface (e.g., eth0):
slurm -i eth0This command focuses monitoring on only the eth0 interface, providing more detailed statistics for that specific interface.
Example 3: Custom Refresh Rate
To set a custom refresh interval (e.g., every 2 seconds):
slurm -d 2This updates the display every 2 seconds instead of the default 1-second interval.
Example 4: Line Mode Display
For a more compact, single-line display per interface:
slurm -lSample Output:
eth0: RX 15.2KB/s TX 8.7KB/s | lo: RX 0.0KB/s TX 0.0KB/sExample 5: Sorted Interface Display
To display interfaces sorted by traffic volume:
slurm -sThis shows the most active interfaces first, making it easier to identify which interfaces are handling the most traffic.
Advanced Usage Scenarios
Monitoring Multiple Interfaces
When working with systems that have multiple network interfaces (ethernet, wireless, VPN connections), slurm automatically detects and monitors all active interfaces:
slurm -c -sThis command uses colored output and sorts interfaces by activity level.
Long-term Monitoring
For continuous monitoring over extended periods:
slurm -d 5 -i eth0This sets up monitoring with 5-second intervals on the eth0 interface, suitable for long-term observation.
Understanding slurm Output
The slurm output provides several key metrics:
Traffic Rate Metrics
- RX (Receive): Incoming traffic rate (KB/s, MB/s)
- TX (Transmit): Outgoing traffic rate (KB/s, MB/s)
- Packets/s: Number of packets transferred per second
Cumulative Statistics
- Total RX: Total bytes received since interface activation
- Total TX: Total bytes transmitted since interface activation
- Uptime: Duration since the interface became active
Troubleshooting Network Issues with slurm
Identifying High Bandwidth Usage
Use slurm to identify interfaces consuming excessive bandwidth:
slurm -s -d 1Monitor the sorted output to quickly identify which interfaces are experiencing high traffic volumes.
Detecting Network Problems
Look for these indicators of potential network issues:
- Unusually high packet rates: May indicate network flooding or DDoS attacks
- Imbalanced RX/TX ratios: Could suggest connectivity problems
- Intermittent traffic spikes: Might indicate network congestion
- Zero traffic on active interfaces: Could indicate interface or cable problems
Best Practices
System Performance Considerations
- Adjust refresh intervals: Use longer intervals (-d option) for systems with limited resources
- Monitor specific interfaces: Focus on relevant interfaces to reduce system overhead
- Use appropriate display modes: Line mode (-l) is less resource-intensive than full display
Network Monitoring Strategy
- Establish baselines: Monitor normal traffic patterns to identify anomalies
- Document interface naming: Keep track of which physical interfaces correspond to interface names
- Combine with other tools: Use slurm alongside tools like iftop, netstat, and ss for comprehensive analysis
Alternative Network Monitoring Tools
While slurm is excellent for basic network monitoring, consider these alternatives for different use cases:
- iftop: Shows bandwidth usage by connection
- nethogs: Displays bandwidth usage by process
- vnstat: Provides historical network statistics
- bmon: More advanced bandwidth monitor with graphical elements
Common Issues and Solutions
Permission Errors
If you encounter permission errors, ensure you have appropriate privileges:
sudo slurmInterface Not Found
To list available interfaces before monitoring:
ip link showThen specify the correct interface name with the -i option.
Display Issues
For terminal compatibility issues, try:
slurm -lThis uses a simpler display format that works better with some terminal emulators.
Conclusion
The slurm command is a valuable tool for Linux system administrators and network professionals who need real-time network monitoring capabilities. Its lightweight design, comprehensive statistics, and flexible display options make it ideal for both quick network checks and extended monitoring sessions. By mastering slurm’s various options and understanding its output, you can effectively monitor network performance, identify issues, and maintain optimal network connectivity on your Linux systems.
Remember to combine slurm with other network diagnostic tools and establish regular monitoring practices to maintain peak network performance and quickly identify potential issues before they impact system functionality.
Related Posts
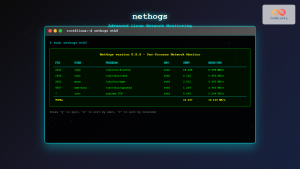
nethogs Advanced Linux: Complete Guide to Per-Process Network Monitoring
Network monitoring is crucial for system administrators and developers who need to track bandwidth usage and identify network-intensive processes. While...
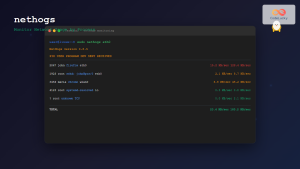
nethogs Command Linux: Monitor Real-Time Network Usage by Process
Network monitoring is a crucial aspect of system administration, especially when you need to identify which processes are consuming bandwidth...
nload Command Linux: Complete Guide to Monitor Network Traffic and Bandwidth in Real-Time
The nload command is a powerful Linux utility that provides real-time monitoring of network traffic and bandwidth usage. Unlike basic...

iptraf Command Linux: Complete Interactive Network Monitoring Guide
The iptraf command is a powerful console-based network monitoring utility for Linux systems that provides real-time IP LAN monitoring capabilities....

cbm Command Linux: Monitor Network Bandwidth in Real-Time with Color Display
The cbm (Color Bandwidth Meter) command is a powerful Linux utility that provides real-time monitoring of network bandwidth usage with...
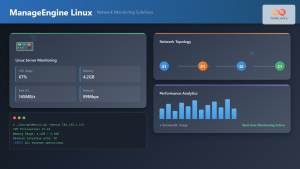
ManageEngine Linux: Complete Network Monitoring Solutions Guide
Network monitoring is crucial for maintaining optimal performance and security in Linux environments. ManageEngine provides powerful network monitoring solutions specifically...
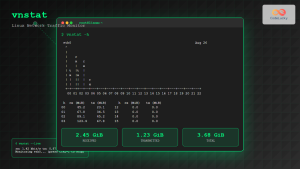
vnstat Command Linux: Complete Network Traffic Monitoring Guide
Network traffic monitoring is a crucial aspect of system administration, and the vnstat command in Linux provides an elegant solution...
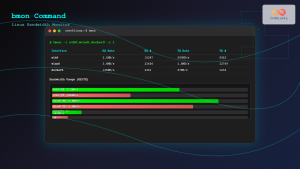
bmon Command Linux: Complete Guide to Real-Time Bandwidth Monitoring and Network Analysis
The bmon (Bandwidth Monitor) command is a powerful Linux utility designed for real-time network bandwidth monitoring and rate estimation. This...
Munin Linux: Complete Guide to Network Resource Monitoring and Performance Analysis
Munin is a powerful networked resource monitoring tool for Linux systems that provides comprehensive insights into system performance, resource utilization,...
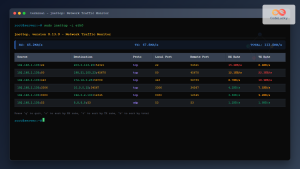
jnettop Command Linux: Monitor Real-Time Network Traffic by Connection
The jnettop command is a powerful Linux network monitoring tool that provides real-time visibility into network traffic organized by individual...

Paessler Linux: Complete Guide to Network Monitoring with PRTG on Linux Systems
Network monitoring is crucial for maintaining optimal performance and security in Linux environments. Paessler PRTG Network Monitor offers comprehensive monitoring...
Wireshark Command Linux: Complete Network Protocol Analyzer Guide
Wireshark is the world's most popular network protocol analyzer, providing deep visibility into network traffic and communication protocols. While most...


