
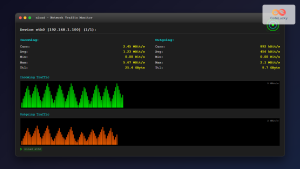
The rrdtool (Round Robin Database Tool) is a powerful Linux command-line utility designed for storing and displaying time-series data in a highly efficient manner. Originally developed by Tobias Oetiker, rrdtool is widely used in network monitoring, system performance tracking, and data visualization applications like Cacti, MRTG, and Nagios.
What is Round Robin Database?
A Round Robin Database (RRD) is a circular buffer that stores time-series data in a fixed-size structure. Unlike traditional databases that grow indefinitely, RRDs maintain a constant size by overwriting old data with new entries. This design makes them perfect for monitoring applications where you need to track metrics over time without consuming unlimited disk space.
Installing rrdtool on Linux
Before using rrdtool, you need to install it on your Linux system:
Ubuntu/Debian:
sudo apt update
sudo apt install rrdtool
CentOS/RHEL/Fedora:
sudo yum install rrdtool    # CentOS/RHEL 7
sudo dnf install rrdtool    # Fedora/RHEL 8+
Arch Linux:
sudo pacman -S rrdtoolBasic rrdtool Syntax
The basic syntax of rrdtool follows this pattern:
rrdtool <command> <options> <arguments>The most commonly used commands include:
create– Create a new RRD fileupdate– Add data to an existing RRDfetch– Retrieve data from an RRDgraph– Generate graphs from RRD datainfo– Display RRD file informationdump– Export RRD data in XML formatrestore– Import data from XML
Creating Your First RRD File
Let’s create a simple RRD file to monitor CPU usage:
rrdtool create cpu_usage.rrd \
    --start 1693000000 \
    --step 300 \
    DS:cpu:GAUGE:600:0:100 \
    RRA:AVERAGE:0.5:1:288 \
    RRA:AVERAGE:0.5:6:336 \
    RRA:AVERAGE:0.5:24:372 \
    RRA:AVERAGE:0.5:288:797
Let’s break down this command:
--start 1693000000: Start time (Unix timestamp)--step 300: Data collection interval (5 minutes)DS:cpu:GAUGE:600:0:100: Data source definitioncpu: Data source nameGAUGE: Data source type600: Heartbeat (max seconds between updates)0:100: Min and max values
RRAentries: Round Robin Archives with different consolidation periods
Data Source Types
RRDtool supports several data source types:
| Type | Description | Use Case |
|---|---|---|
| GAUGE | Stores values as-is | Temperature, CPU usage, memory usage |
| COUNTER | Monotonically increasing counter | Network bytes, disk I/O operations |
| DERIVE | Rate of change (can be negative) | Stock prices, account balances |
| ABSOLUTE | Counter that resets to zero | Number of hits per interval |
Updating RRD Files with Data
Once you have created an RRD file, you can add data using the update command:
# Update with current timestamp and CPU value of 45%
rrdtool update cpu_usage.rrd N:45

# Update with specific timestamp
rrdtool update cpu_usage.rrd 1693001000:52

# Multiple updates at once
rrdtool update cpu_usage.rrd \
    1693001300:48 \
    1693001600:51 \
    1693001900:47
The N represents “now” (current timestamp).
Retrieving Data from RRD Files
Use the fetch command to retrieve stored data:
# Fetch average data for the last 24 hours
rrdtool fetch cpu_usage.rrd AVERAGE --start -86400 --end now
Sample output:
                     cpu

1693000800: 4.5000000000e+01
1693001100: 5.2000000000e+01
1693001400: 4.8000000000e+01
1693001700: 5.1000000000e+01
Creating Graphs with rrdtool
One of rrdtool’s most powerful features is graph generation. Here’s how to create a basic CPU usage graph:
rrdtool graph cpu_graph.png \
    --title "CPU Usage Over Time" \
    --vertical-label "CPU Percentage" \
    --start -86400 \
    --end now \
    --width 800 \
    --height 400 \
    DEF:cpu=cpu_usage.rrd:cpu:AVERAGE \
    LINE2:cpu#FF0000:"CPU Usage" \
    GPRINT:cpu:LAST:"Current\: %5.2lf%%" \
    GPRINT:cpu:AVERAGE:"Average\: %5.2lf%%" \
    GPRINT:cpu:MAX:"Maximum\: %5.2lf%%"
This creates a PNG image with:
- A red line showing CPU usage
- Current, average, and maximum values displayed
- 800×400 pixel dimensions
- Data from the last 24 hours
Advanced Graph Examples
Multi-Line Graph with Areas
Create a more complex graph showing memory usage:
rrdtool graph memory_graph.png \
    --title "Memory Usage" \
    --vertical-label "Memory (MB)" \
    --start -3600 \
    --end now \
    --width 800 \
    --height 400 \
    DEF:used=memory.rrd:used:AVERAGE \
    DEF:cached=memory.rrd:cached:AVERAGE \
    DEF:free=memory.rrd:free:AVERAGE \
    AREA:used#FF0000:"Used Memory" \
    STACK:cached#00FF00:"Cached Memory" \
    STACK:free#0000FF:"Free Memory" \
    LINE1:used#800000 \
    GPRINT:used:LAST:"Used\: %5.0lf MB" \
    GPRINT:cached:LAST:"Cached\: %5.0lf MB" \
    GPRINT:free:LAST:"Free\: %5.0lf MB"
RRD File Information and Management
Get detailed information about an RRD file:
rrdtool info cpu_usage.rrdSample output:
filename = "cpu_usage.rrd"
rrd_version = "0003"
step = 300
last_update = 1693002000
header_size = 2872
ds[cpu].type = "GAUGE"
ds[cpu].minimal_heartbeat = 600
ds[cpu].min = 0.0000000000e+00
ds[cpu].max = 1.0000000000e+02
ds[cpu].last_ds = "45"
ds[cpu].value = 4.5000000000e+01
ds[cpu].unknown_sec = 0
Practical Monitoring Script Example
Here’s a practical bash script for system monitoring using rrdtool:
#!/bin/bash

# System monitoring script using rrdtool
RRD_FILE="/var/lib/rrd/system_stats.rrd"

# Create RRD file if it doesn't exist
if [ ! -f "$RRD_FILE" ]; then
    rrdtool create "$RRD_FILE" \
        --start `date +%s` \
        --step 300 \
        DS:cpu:GAUGE:600:0:100 \
        DS:memory:GAUGE:600:0:100 \
        DS:disk:GAUGE:600:0:100 \
        RRA:AVERAGE:0.5:1:576 \
        RRA:AVERAGE:0.5:6:672 \
        RRA:AVERAGE:0.5:24:732 \
        RRA:AVERAGE:0.5:144:1460
fi

# Get system metrics
CPU_USAGE=$(top -bn1 | grep "Cpu(s)" | awk '{print $2}' | cut -d'%' -f1)
MEMORY_USAGE=$(free | grep Mem | awk '{printf "%.1f", ($3/$2) * 100.0}')
DISK_USAGE=$(df -h / | tail -1 | awk '{print $5}' | cut -d'%' -f1)

# Update RRD with current values
rrdtool update "$RRD_FILE" N:$CPU_USAGE:$MEMORY_USAGE:$DISK_USAGE

echo "Updated RRD: CPU=$CPU_USAGE%, Memory=$MEMORY_USAGE%, Disk=$DISK_USAGE%"
Exporting and Importing RRD Data
Export RRD data to XML format for backup or transfer:
# Export to XML
rrdtool dump cpu_usage.rrd > cpu_backup.xml

# Restore from XML
rrdtool restore cpu_backup.xml cpu_restored.rrd
Common rrdtool Options and Parameters
Graph Formatting Options
| Option | Description | Example |
|---|---|---|
--title |
Graph title | --title "Server Performance" |
--vertical-label |
Y-axis label | --vertical-label "Percentage" |
--width/--height |
Image dimensions | --width 800 --height 400 |
--start/--end |
Time range | --start -3600 --end now |
--upper-limit |
Y-axis maximum | --upper-limit 100 |
--lower-limit |
Y-axis minimum | --lower-limit 0 |
Troubleshooting Common Issues
Permission Issues
Ensure proper file permissions:
chmod 644 /path/to/your.rrd
chown user:group /path/to/your.rrd
Time Synchronization
RRDtool is sensitive to system time. Ensure your system clock is synchronized:
ntpdate -s time.nist.govData Validation
Check for data integrity issues:
rrdtool info your_file.rrd | grep last_updatePerformance Optimization Tips
- Choose appropriate step intervals: Don’t collect data more frequently than necessary
- Optimize RRA configuration: Balance between data granularity and storage efficiency
- Use batch updates: Update multiple data points at once when possible
- Monitor file sizes: RRD files have fixed sizes, but improper configuration can waste space
Integration with Monitoring Tools
RRDtool integrates seamlessly with popular monitoring solutions:
- Cacti: Web-based graphing solution built on RRDtool
- MRTG: Multi Router Traffic Grapher using RRDs
- Nagios: Can use RRDtool for performance data storage
- Zabbix: Supports RRDtool for historical data
Best Practices
- Plan your data structure: Design RRAs based on your reporting needs
- Regular backups: Use
rrdtool dumpfor XML backups - Monitor disk space: Even though RRDs have fixed sizes, multiple files add up
- Automate data collection: Use cron jobs for regular updates
- Validate data inputs: Ensure data quality before updates
Conclusion
The rrdtool command is an essential utility for Linux system administrators and developers working with time-series data. Its efficient storage mechanism, powerful graphing capabilities, and integration with monitoring tools make it ideal for tracking system performance, network statistics, and other temporal data. Whether you’re building custom monitoring solutions or working with existing tools like Cacti or MRTG, mastering rrdtool will significantly enhance your data visualization and monitoring capabilities.
With the examples and techniques covered in this guide, you now have the foundation to implement robust monitoring solutions using RRDtool. Start with simple use cases and gradually build more complex monitoring systems as your requirements grow.
Related Posts
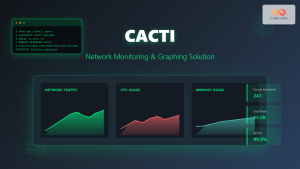
Cacti Linux: Complete Network Monitoring and Graphing Solution
Cacti is a comprehensive network graphing solution designed to harness the power of RRDtool's data storage and graphing functionality. Built...
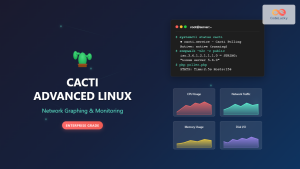
Cacti Advanced Linux: Complete Guide to Enterprise Network Graphing and Monitoring
Cacti stands as one of the most powerful open-source network graphing solutions available for Linux systems, providing comprehensive network monitoring...
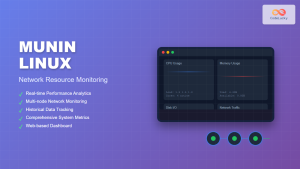
Munin Linux: Complete Guide to Network Resource Monitoring and Performance Analysis
Munin is a powerful networked resource monitoring tool for Linux systems that provides comprehensive insights into system performance, resource utilization,...
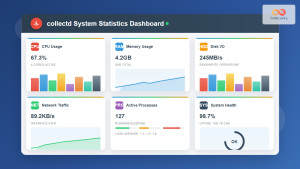
collectd Linux: Complete Guide to System Statistics Collection Daemon
The collectd daemon is a powerful system statistics collection tool for Linux that gathers performance metrics from various system components...

InfluxDB Linux: Complete Guide to Time Series Database Installation and Management
InfluxDB is a powerful open-source time series database designed to handle high write and query loads for applications involving time-stamped...
ntpdate Command Linux: Complete Guide to Network Time Synchronization (Deprecated Tool)
The ntpdate command was once a cornerstone tool for Linux system administrators to synchronize system time with Network Time Protocol...
watch Command Linux: Monitor and Execute Commands Repeatedly in Real-Time
The watch command is one of the most powerful utilities in Linux for executing commands repeatedly at regular intervals and...

cbm Command Linux: Monitor Network Bandwidth in Real-Time with Color Display
The cbm (Color Bandwidth Meter) command is a powerful Linux utility that provides real-time monitoring of network bandwidth usage with...
chrony Linux: Complete Guide to NTP Client and Server Configuration
Network Time Protocol (NTP) synchronization is crucial for maintaining accurate time across Linux systems. chrony is a modern, versatile NTP...

Redis Linux: Complete Guide to In-Memory Data Structure Store Installation and Commands
Redis (Remote Dictionary Server) is a powerful, open-source, in-memory data structure store that functions as a database, cache, and message...
vnstat Command Linux: Complete Network Traffic Monitoring Guide
Network traffic monitoring is a crucial aspect of system administration, and the vnstat command in Linux provides an elegant solution...
nload Command Linux: Complete Guide to Monitor Network Traffic and Bandwidth in Real-Time
The nload command is a powerful Linux utility that provides real-time monitoring of network traffic and bandwidth usage. Unlike basic...


