Understanding Resource Utilization in Modern Operating Systems
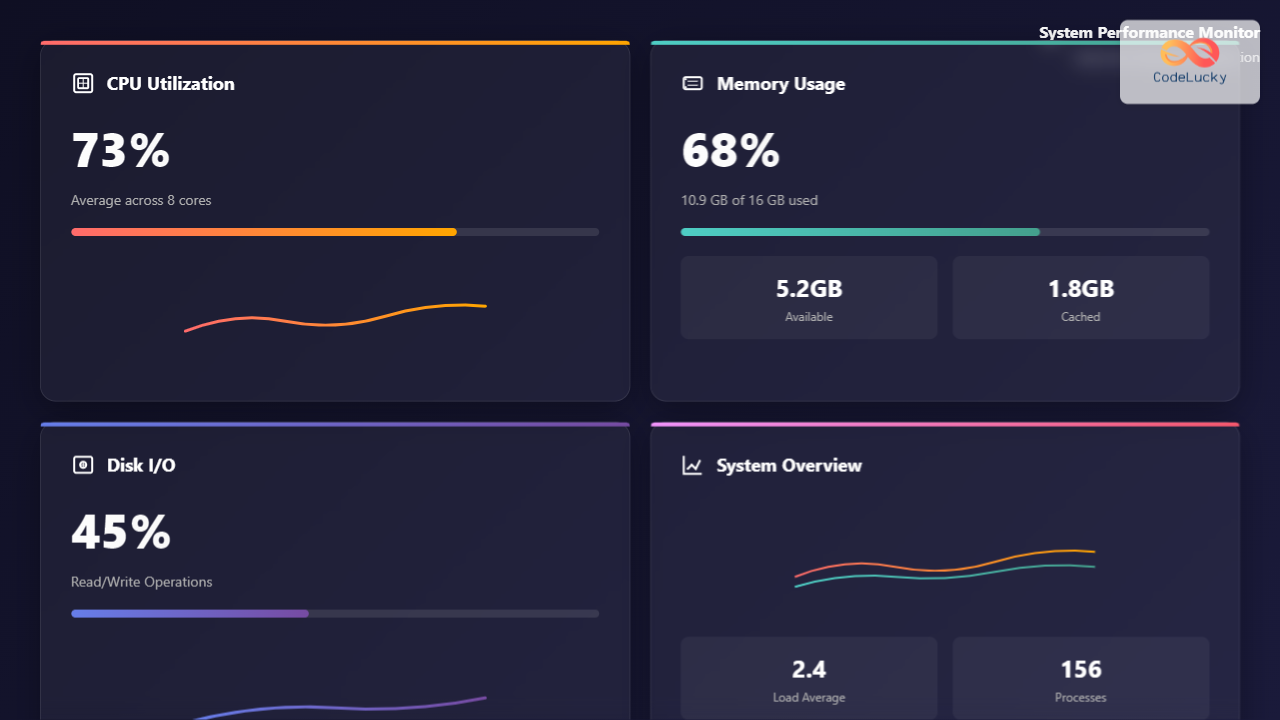
Resource utilization is the cornerstone of system performance, determining how efficiently your operating system manages CPU processing power, memory allocation, and input/output operations. Effective resource management can dramatically improve application responsiveness, reduce system bottlenecks, and maximize hardware investment returns.
CPU Optimization Strategies
Understanding CPU Utilization Metrics
CPU utilization encompasses several key metrics that system administrators must monitor:
- User Time: Percentage of CPU cycles spent executing user-space applications
- System Time: CPU cycles consumed by kernel operations and system calls
- Idle Time: Percentage when CPU cores remain unused
- I/O Wait: Time CPU spends waiting for input/output operations
- Interrupt Handling: CPU cycles dedicated to processing hardware interrupts
CPU Performance Monitoring Tools
Linux Command-Line Tools
# Monitor real-time CPU usage
top -p $(pgrep -d',' process_name)

# Detailed CPU statistics
sar -u 1 5

# Process-specific CPU analysis
pidstat -u -p PID 1

# CPU frequency and governor information
cpufreq-info

# Core-specific utilization
mpstat -P ALL 1
Windows Performance Monitoring
# PowerShell CPU monitoring
Get-Counter "\Processor(_Total)\% Processor Time" -SampleInterval 1 -MaxSamples 5

# Task Manager equivalent via CLI
tasklist /fo table /fi "cputime gt 00:01:00"

# Performance counters for specific processes
typeperf "\Process(notepad)\% Processor Time" -sc 10
CPU Optimization Techniques
Process Priority Management
# Adjust process priority (nice values)
nice -n 10 ./cpu_intensive_task

# Modify running process priority
renice -n 5 -p 1234

# Real-time priority assignment
chrt -f -p 99 1234
CPU Affinity Configuration
# Bind process to specific CPU cores
taskset -c 0,1 ./application

# Check current CPU affinity
taskset -p 1234

# Set affinity for running process
taskset -pc 2,3 1234
Memory Optimization and Management
Memory Hierarchy Understanding
Modern systems employ a complex memory hierarchy designed for optimal performance:
| Memory Type | Access Time | Capacity | Cost per GB |
|---|---|---|---|
| CPU Registers | <1 ns | Bytes | Very High |
| L1 Cache | 1-2 ns | 32-64 KB | Very High |
| L2 Cache | 3-10 ns | 256KB-2MB | High |
| L3 Cache | 10-50 ns | 8-64 MB | High |
| Main RAM | 50-200 ns | 4-128 GB | Medium |
| SSD Storage | 0.1-1 ms | 256GB-8TB | Low |
| HDD Storage | 5-20 ms | 500GB-20TB | Very Low |
Memory Monitoring and Analysis
Linux Memory Monitoring
# Comprehensive memory information
free -h

# Detailed memory breakdown
cat /proc/meminfo

# Process memory usage
pmap -x PID

# Memory usage by process
ps aux --sort=-%mem | head -10

# Page fault analysis
sar -B 1 5

# NUMA memory information
numactl --hardware
Memory Leak Detection
# Valgrind memory analysis
valgrind --leak-check=full --track-origins=yes ./program

# Memory usage tracking over time
while true; do
    ps -p PID -o pid,vsz,rss,comm
    sleep 1
done

# System-wide memory monitoring
vmstat 1 10
Memory Optimization Strategies
Virtual Memory Management
# Adjust swappiness (0-100)
echo 10 > /proc/sys/vm/swappiness

# Configure dirty page writeback
echo 15 > /proc/sys/vm/dirty_background_ratio
echo 30 > /proc/sys/vm/dirty_ratio

# Transparent Huge Pages configuration
echo never > /sys/kernel/mm/transparent_hugepage/enabled

# Memory compaction
echo 1 > /proc/sys/vm/compact_memory
Buffer and Cache Management
# Clear system caches (emergency use only)
sync && echo 3 > /proc/sys/vm/drop_caches

# Monitor buffer/cache usage
watch -n 1 'cat /proc/meminfo | grep -E "Buffers|Cached|MemFree"'

# Configure zone reclaim
echo 0 > /proc/sys/vm/zone_reclaim_mode
I/O Optimization and Performance Tuning
Understanding I/O Subsystem
The I/O subsystem represents one of the most complex performance bottlenecks in modern computing. Understanding different I/O types and their characteristics is crucial for optimization:
I/O Operation Types
- Sequential I/O: Reading/writing data in contiguous blocks
- Random I/O: Accessing data at non-sequential locations
- Synchronous I/O: Operations that block until completion
- Asynchronous I/O: Non-blocking operations with callback mechanisms
I/O Performance Monitoring
Linux I/O Analysis Tools
# Real-time I/O statistics
iostat -x 1

# Process I/O monitoring
iotop -a

# Detailed block device statistics
sar -d 1 5

# I/O latency analysis
ioping /dev/sda

# File system I/O patterns
blktrace /dev/sda

# Network I/O monitoring
iftop -i eth0
netstat -i 1
Advanced I/O Profiling
# I/O scheduler analysis
cat /sys/block/sda/queue/scheduler

# Queue depth monitoring
cat /sys/block/sda/queue/nr_requests

# I/O bandwidth testing
dd if=/dev/zero of=/tmp/testfile bs=1G count=1 oflag=direct

# Filesystem performance testing
fio --name=random-write --ioengine=posix --rw=randwrite --bs=4k --size=4g --numjobs=1 --iodepth=1 --runtime=60 --time_based --end_fsync=1
I/O Optimization Techniques
I/O Scheduler Configuration
# Change I/O scheduler
echo mq-deadline > /sys/block/sda/queue/scheduler

# Configure scheduler parameters
echo 8 > /sys/block/sda/queue/iosched/fifo_batch

# Optimize for SSDs
echo noop > /sys/block/nvme0n1/queue/scheduler

# Queue depth adjustment
echo 32 > /sys/block/sda/queue/nr_requests
File System Optimization
# Mount options for performance
mount -o noatime,nodiratime,data=writeback /dev/sda1 /mnt/data

# Ext4 optimization
tune2fs -o journal_data_writeback /dev/sda1

# XFS optimization
mount -o noatime,largeio,swalloc,allocsize=16m /dev/sdb1 /mnt/xfs

# Buffer size tuning
echo 16777216 > /proc/sys/net/core/rmem_max
echo 16777216 > /proc/sys/net/core/wmem_max
Network I/O Optimization
TCP/IP Stack Tuning
# TCP congestion control
echo bbr > /proc/sys/net/ipv4/tcp_congestion_control

# TCP window scaling
echo 1 > /proc/sys/net/ipv4/tcp_window_scaling

# TCP buffer sizes
echo "4096 87380 16777216" > /proc/sys/net/ipv4/tcp_rmem
echo "4096 65536 16777216" > /proc/sys/net/ipv4/tcp_wmem

# Connection tracking optimization
echo 1048576 > /proc/sys/net/netfilter/nf_conntrack_max
Integrated Resource Management Strategies
Holistic Performance Monitoring
Effective resource utilization requires monitoring all components simultaneously to identify interdependencies and bottlenecks:
# Comprehensive system monitoring script
#!/bin/bash

# Function to log system metrics
log_metrics() {
    local timestamp=$(date '+%Y-%m-%d %H:%M:%S')

    # CPU metrics
    local cpu_usage=$(top -bn1 | grep "Cpu(s)" | awk '{print $2}' | sed 's/%us,//')
    local load_avg=$(uptime | awk -F'load average:' '{print $2}')

    # Memory metrics
    local mem_usage=$(free | grep Mem | awk '{printf "%.2f", $3/$2 * 100}')
    local swap_usage=$(free | grep Swap | awk '{printf "%.2f", $3/$2 * 100}')

    # I/O metrics
    local io_wait=$(iostat -c 1 2 | tail -1 | awk '{print $4}')

    echo "$timestamp,CPU:${cpu_usage}%,Load:${load_avg},Memory:${mem_usage}%,Swap:${swap_usage}%,IOWait:${io_wait}%"
}

# Continuous monitoring loop
while true; do
    log_metrics >> system_metrics.log
    sleep 10
done
Resource Allocation Policies
Control Groups (cgroups) Configuration
# Create CPU-limited cgroup
mkdir /sys/fs/cgroup/cpu/limited_apps
echo 50000 > /sys/fs/cgroup/cpu/limited_apps/cpu.cfs_quota_us

# Memory-limited cgroup
mkdir /sys/fs/cgroup/memory/limited_memory
echo 1G > /sys/fs/cgroup/memory/limited_memory/memory.limit_in_bytes

# I/O bandwidth limiting
mkdir /sys/fs/cgroup/blkio/limited_io
echo "8:0 1048576" > /sys/fs/cgroup/blkio/limited_io/blkio.throttle.read_bps_device

# Assign process to cgroup
echo PID > /sys/fs/cgroup/cpu/limited_apps/tasks
systemd Resource Management
# Service resource limits in systemd
[Service]
CPUQuota=50%
MemoryLimit=1G
IOWeight=100
TasksMax=100

# Slice configuration for resource isolation
[Slice]
CPUAccounting=yes
MemoryAccounting=yes
IOAccounting=yes
Performance Tuning Best Practices
Baseline Establishment
Before implementing optimizations, establish performance baselines:
# System performance baseline script
#!/bin/bash

echo "=== System Performance Baseline ==="
echo "Date: $(date)"
echo "Kernel: $(uname -r)"
echo "CPU: $(lscpu | grep 'Model name' | cut -d':' -f2 | xargs)"
echo "Memory: $(free -h | grep Mem | awk '{print $2}')"
echo "Storage: $(df -h / | tail -1 | awk '{print $2}')"

echo -e "\n=== CPU Baseline ==="
sar -u 1 10 | tail -1

echo -e "\n=== Memory Baseline ==="
free -h

echo -e "\n=== I/O Baseline ==="
iostat -x 1 5 | grep -E '^Device|sda|nvme'

echo -e "\n=== Network Baseline ==="
sar -n DEV 1 5 | grep -E '^Average|eth0|ens'
Bottleneck Identification Matrix
| Symptom | Likely Bottleneck | Primary Metric | Action |
|---|---|---|---|
| High load average | CPU | Load > CPU cores | Process optimization |
| High I/O wait | Disk I/O | %iowait > 20% | Storage optimization |
| Frequent swapping | Memory | Swap utilization > 10% | Memory expansion |
| Network timeouts | Network I/O | Packet loss > 0.1% | Network tuning |
| Application hangs | Resource contention | Multiple high metrics | Resource isolation |
Optimization Priority Framework
- Identify the bottleneck: Use monitoring tools to determine the constraining resource
- Quantify the impact: Measure performance metrics before optimization
- Implement targeted fixes: Address the most significant bottleneck first
- Monitor improvements: Validate that changes produce expected results
- Iterate and refine: Continue optimizing secondary bottlenecks
Advanced Resource Optimization Techniques
NUMA Awareness
For multi-socket systems, Non-Uniform Memory Access (NUMA) optimization is crucial:
# Check NUMA topology
numactl --hardware

# NUMA-aware process binding
numactl --cpunodebind=0 --membind=0 ./cpu_intensive_app

# Monitor NUMA memory allocation
numastat -p PID

# Automatic NUMA balancing
echo 1 > /proc/sys/kernel/numa_balancing
Real-time System Optimization
# Real-time kernel configuration
echo 1 > /proc/sys/kernel/sched_rt_runtime_us

# CPU isolation for real-time tasks
echo 2,3 > /sys/devices/system/cpu/isolated

# IRQ affinity configuration
echo 1 > /proc/irq/24/smp_affinity

# Disable CPU frequency scaling
echo performance > /sys/devices/system/cpu/cpu*/cpufreq/scaling_governor
Monitoring and Alerting Framework
Automated Performance Monitoring
# Python performance monitoring script
import psutil
import time
import json
from datetime import datetime

class SystemMonitor:
    def __init__(self):
        self.thresholds = {
            'cpu_percent': 80,
            'memory_percent': 85,
            'disk_io_util': 90,
            'network_errors': 100
        }

    def collect_metrics(self):
        return {
            'timestamp': datetime.now().isoformat(),
            'cpu': {
                'percent': psutil.cpu_percent(interval=1),
                'load_avg': psutil.getloadavg(),
                'count': psutil.cpu_count()
            },
            'memory': {
                'percent': psutil.virtual_memory().percent,
                'available': psutil.virtual_memory().available,
                'swap_percent': psutil.swap_memory().percent
            },
            'disk': {
                'io_counters': dict(psutil.disk_io_counters()._asdict()),
                'usage': psutil.disk_usage('/').percent
            },
            'network': dict(psutil.net_io_counters()._asdict())
        }

    def check_thresholds(self, metrics):
        alerts = []

        if metrics['cpu']['percent'] > self.thresholds['cpu_percent']:
            alerts.append(f"High CPU usage: {metrics['cpu']['percent']}%")

        if metrics['memory']['percent'] > self.thresholds['memory_percent']:
            alerts.append(f"High memory usage: {metrics['memory']['percent']}%")

        return alerts

# Usage
monitor = SystemMonitor()
while True:
    metrics = monitor.collect_metrics()
    alerts = monitor.check_thresholds(metrics)

    if alerts:
        for alert in alerts:
            print(f"ALERT: {alert}")

    time.sleep(60)
Resource utilization optimization is an ongoing process that requires continuous monitoring, analysis, and adjustment. By implementing the strategies and techniques outlined in this comprehensive guide, system administrators and developers can significantly improve system performance, reduce bottlenecks, and ensure optimal resource usage across CPU, memory, and I/O subsystems. The key to success lies in understanding the interdependencies between different system components and taking a holistic approach to performance optimization.

