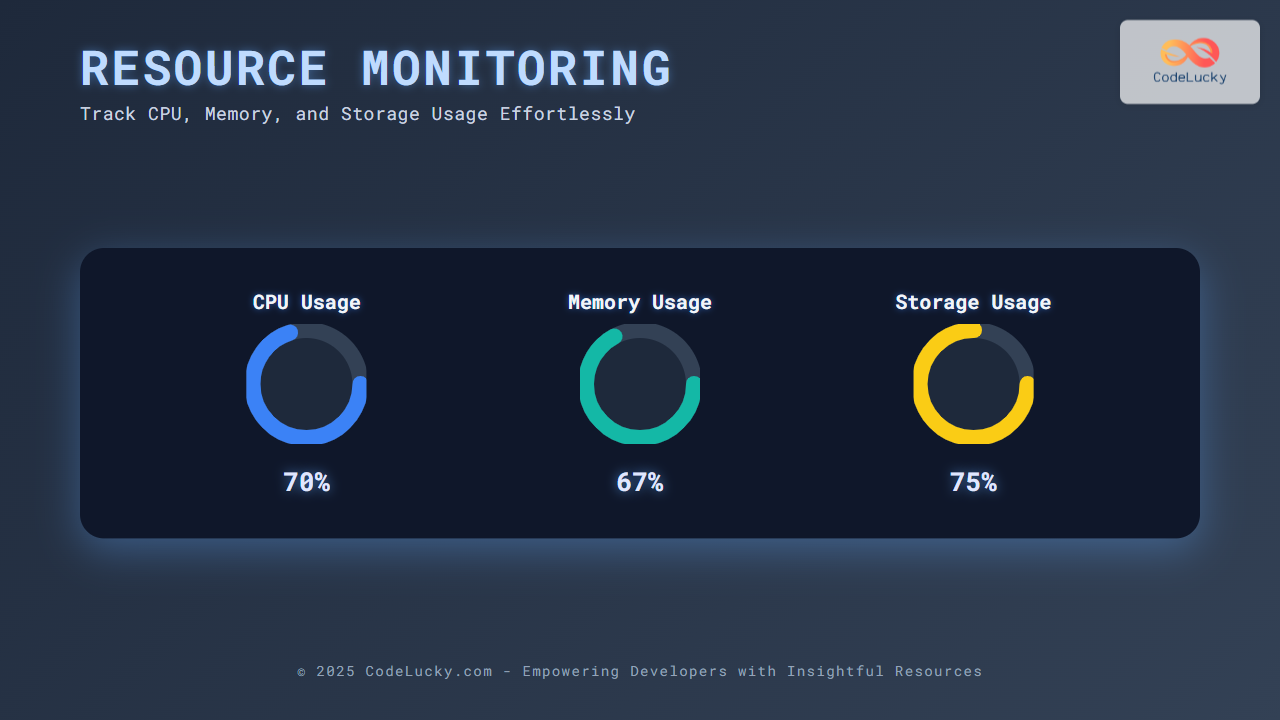
Resource monitoring is essential for maintaining the health and performance of any computing system. Tracking CPU, memory, and storage usage helps diagnose bottlenecks, optimize applications, and ensure resource availability. This article presents a detailed guide on how to monitor these key system resources using various tools and methods, complete with clear examples and useful visualizations.
Why Monitor CPU, Memory, and Storage?
System resource monitoring is critical to:
- Prevent performance degradation: High CPU or low memory availability can slow down applications.
- Detect and resolve bottlenecks: Identify processes or services consuming abnormal resources.
- Plan capacity: Track usage trends to anticipate hardware upgrades.
- Maintain system stability and uptime: Avoid crashes caused by resource exhaustion.
Overview of Key System Resources
The three most common resources monitored are:
- CPU (Central Processing Unit): Measures processor utilization and load.
- Memory (RAM): Tracks usage, availability, and swaps.
- Storage (Disk): Monitors disk space, I/O operations, and performance.
How to Monitor CPU Usage
CPU utilization indicates the percentage of time the CPU is actively processing instructions.
Linux Command Line Tools
top: Real-time CPU usage by processes.htop: Enhanced interactive process viewer with CPU meter bars.mpstat: CPU statistics per processor core.
top -bn1 | grep "Cpu(s)"
# Output example:
%Cpu(s):  12.3 us,  4.5 sy,  0.0 ni, 82.2 id,  0.9 wa,  0.0 hi,  0.1 si,  0.0 st
Explanation: Here, 12.3% CPU is used by user processes, 4.5% by system, and 82.2% is idle.
Windows Built-in Tools
- Task Manager: Display CPU usage graph and per-process details.
- Performance Monitor (perfmon): Allows setting counters to track CPU usage over time.
How to Monitor Memory Usage
Memory monitoring involves tracking total, used, free, and cached memory as well as swap usage.
Linux:
free -h
# Output example:
              total        used        free      shared  buff/cache   available
Mem:           7.8G        3.2G        2.0G        220M        2.6G        4.2G
Swap:          2.0G         0B         2.0G
This shows total RAM, how much is used, free, and what portion is buffered/cached for improved performance.
Windows:
- Task Manager’s Performance tab shows memory usage graphs.
- Resource Monitor provides detailed memory allocation breakdown.
How to Monitor Storage Usage
Storage or disk monitoring tracks available space, read/write speeds, and I/O operations.
Linux Disk Usage and I/O
df -h: Provides human-readable disk space usage of mounted filesystems.iostat: Shows disk read/write operations and throughput.
df -h /
# Example output:
Filesystem      Size  Used Avail Use% Mounted on
/dev/sda1        50G   20G   28G  42% /
Windows Storage Monitoring
- File Explorer shows free space per drive.
- Disk Management and Resource Monitor offer detailed disk activity and health.
Practical Python Script for Real-Time Monitoring
The following Python code demonstrates how to programmatically monitor CPU, memory, and disk usage using the popular psutil library. Running this script outputs system stats every two seconds.
import psutil
import time

def bytes_to_gb(bytes_value):
    return round(bytes_value / (1024**3), 2)

try:
    while True:
        cpu_percent = psutil.cpu_percent(interval=1)
        mem = psutil.virtual_memory()
        disk = psutil.disk_usage('/')

        print(f"CPU Usage: {cpu_percent}%")
        print(f"Memory Usage: {mem.percent}% ({bytes_to_gb(mem.used)} GB / {bytes_to_gb(mem.total)} GB)")
        print(f"Disk Usage (/): {disk.percent}% ({bytes_to_gb(disk.used)} GB / {bytes_to_gb(disk.total)} GB)")
        print("-" * 40)
        time.sleep(1)
except KeyboardInterrupt:
    print("Monitoring stopped.")
This continuous output helps track resource usage trends in real time.
Interactive Visualization with Mermaid
Mermaid diagrams can visually represent system states or resource flow to aid comprehension. For instance, CPU and memory usage trends can be conceptualized as a flow from system load to resource consumption.
Best Practices for Resource Monitoring
- Use automated monitoring tools with alerting capabilities (e.g., Nagios, Zabbix, Prometheus).
- Regularly review logs and trends to proactively address issues.
- Combine multiple metrics for a holistic view (CPU spikes combined with memory leaks indicate different problems).
- Leverage cloud-native monitoring if applicable for scalable environments.
Conclusion
Effective resource monitoring requires continuous vigilance on CPU, memory, and storage usage. Utilizing system tools, scripting solutions, and visualizations empowers administrators and developers to ensure optimal system health and performance. The combination of real-time metrics and historical trends offers actionable insights for proactive system management.

