The ps command is one of the most fundamental and powerful tools in Linux for displaying information about running processes. Whether you’re a system administrator monitoring server performance or a developer troubleshooting applications, understanding the ps command is essential for effective Linux system management.
What is the ps Command?
The ps command (short for “process status”) provides a snapshot of currently running processes on your Linux system. It displays detailed information including process IDs (PIDs), CPU usage, memory consumption, execution time, and the command that started each process.
Unlike dynamic monitoring tools like top or htop, ps provides a static snapshot at the moment of execution, making it perfect for scripting and automation tasks.
Basic Syntax and Usage
The basic syntax of the ps command is:
ps [options]Let’s start with the most basic usage:
$ ps
    PID TTY          TIME CMD
   1234 pts/0    00:00:00 bash
   1567 pts/0    00:00:00 ps
This simple command shows processes running in your current terminal session. The output includes:
- PID: Process ID number
- TTY: Terminal type
- TIME: CPU time consumed
- CMD: Command name
Common ps Command Options
Display All Processes
To view all running processes system-wide, use:
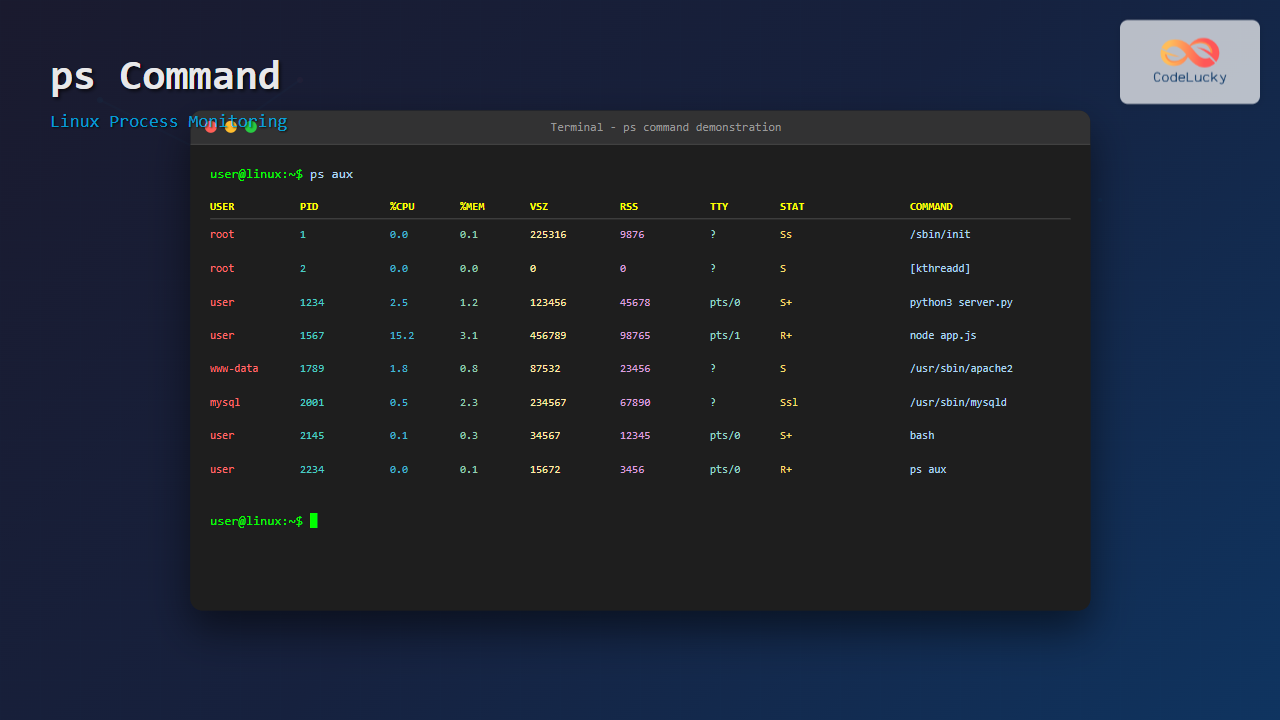
$ ps auxSample output:
USER         PID %CPU %MEM    VSZ   RSS TTY      STAT START   TIME COMMAND
root           1  0.0  0.1 225316  9876 ?        Ss   08:15   0:01 /sbin/init
root           2  0.0  0.0      0     0 ?        S    08:15   0:00 [kthreadd]
user        1234  2.5  1.2 123456 45678 pts/0    R+   10:30   0:05 python3 app.py
user        1567  0.0  0.1  15672  3456 pts/0    R+   10:35   0:00 ps aux
The aux options breakdown:
- a: Show processes for all users
- u: Display user-oriented format
- x: Include processes not attached to a terminal
BSD vs System V Style
Linux supports both BSD and System V style options. Here are equivalent commands:
# BSD style (no dashes)
$ ps aux

# System V style (with dashes)
$ ps -ef
Sample ps -ef output:
UID          PID    PPID  C STIME TTY          TIME CMD
root           1       0  0 08:15 ?        00:00:01 /sbin/init
root           2       1  0 08:15 ?        00:00:00 [kthreadd]
user        1234    1100  2 10:30 pts/0    00:00:05 python3 app.py
Advanced ps Command Examples
Filter Processes by User
To display processes for a specific user:
$ ps -u username
$ ps --user username

# Example output
    PID TTY          TIME CMD
   1234 pts/0    00:00:02 bash
   1456 pts/0    00:00:01 vim
   1789 pts/0    00:00:00 python3
Show Process Tree (Hierarchy)
Display processes in a tree format showing parent-child relationships:
$ ps --forest -efOr use the more visual pstree command:
$ ps axjf

# Sample output
 PPID   PID  PGID   SID TTY      TPGID STAT   UID   TIME COMMAND
    0     1     1     1 ?           -1 Ss       0   0:01 /sbin/init
    1   123   123   123 ?           -1 Ss       0   0:00 /usr/sbin/sshd
  123  1234  1234  1234 ?           -1 Ss    1000   0:00  \_ sshd: user@pts/0
 1234  1456  1456  1234 pts/0    1789 Ss    1000   0:00      \_ bash
 1456  1789  1789  1234 pts/0    1789 R+    1000   0:00          \_ ps axjf
Custom Column Output
You can specify exactly which columns to display:
$ ps -eo pid,ppid,cmd,pcpu,pmem

# Example output
    PID    PPID CMD                         %CPU %MEM
      1       0 /sbin/init                   0.0  0.1
    123       1 /usr/sbin/sshd -D            0.0  0.2
   1234     123 sshd: user@pts/0             0.0  0.3
   1456    1234 bash                         0.0  0.2
   1789    1456 python3 /home/user/app.py    5.2  2.1
Process States and Status Codes
The STAT column shows the current state of each process:
| Code | Description |
|---|---|
| R | Running or runnable |
| S | Interruptible sleep |
| D | Uninterruptible sleep |
| T | Stopped |
| Z | Zombie process |
| + | Foreground process |
| s | Session leader |
| < | High priority |
| N | Low priority |
Practical Use Cases and Examples
Find Processes by Name
To find specific processes by name, combine ps with grep:
$ ps aux | grep python

# Output
user     1234  2.1  1.5  87532 45678 pts/0   S+   10:30   0:05 python3 app.py
user     1567  2.5  2.1 123456 67890 pts/1   S+   10:32   0:03 python3 server.py
user     1789  0.0  0.1  15672  3456 pts/0   S+   10:35   0:00 grep --color=auto python
Monitor Resource Usage
Display processes sorted by CPU usage:
$ ps aux --sort=-%cpu | head -10

# Sample output
USER       PID %CPU %MEM    VSZ   RSS TTY      STAT START   TIME COMMAND
user      1234  15.2  3.1 456789 98765 ?        R    10:30   2:15 node server.js
user      1567   8.7  2.5 234567 78901 ?        S    10:32   1:23 python3 ml_model.py
root       123   2.1  0.8  87532 23456 ?        S    08:15   0:45 /usr/sbin/httpd
Sort by memory usage:
$ ps aux --sort=-%mem | head -10Find Parent and Child Processes
To see the parent process ID (PPID) for troubleshooting:
$ ps -eo pid,ppid,cmd | grep -E "(PID|target_process)"

# Example
    PID    PPID CMD
   1234    1100 python3 parent_script.py
   1567    1234 python3 child_process.py
   1789    1234 python3 another_child.py
Combining ps with Other Commands
Kill Processes by Name
Find and terminate processes matching a pattern:
# Find the process
$ ps aux | grep "problematic_app"

# Kill by PID
$ kill 1234

# Or use pkill for pattern matching
$ pkill -f "problematic_app"
Process Monitoring Script
Here’s a practical bash script for monitoring specific processes:
#!/bin/bash
# monitor_process.sh

PROCESS_NAME="nginx"
THRESHOLD_CPU=80.0

while true; do
    CPU_USAGE=$(ps aux | grep $PROCESS_NAME | grep -v grep | awk '{print $3}')

    if (( $(echo "$CPU_USAGE > $THRESHOLD_CPU" | bc -l) )); then
        echo "WARNING: $PROCESS_NAME CPU usage is $CPU_USAGE%"
        # Add notification or remedial action here
    fi

    sleep 30
done
Real-Time Process Information
While ps provides snapshots, you can create a simple monitoring loop:
# Monitor specific process every 2 seconds
$ watch -n 2 'ps aux | grep python'

# Or use a one-liner
$ while true; do clear; ps aux --sort=-%cpu | head -15; sleep 2; done
Troubleshooting with ps Command
Identifying Zombie Processes
Find zombie processes that need cleanup:
$ ps aux | grep -E "(STAT|Z)"

# Output showing zombie process
USER       PID %CPU %MEM    VSZ   RSS TTY      STAT START   TIME COMMAND
user      1234  0.0  0.0      0     0 ?        Z    10:30   0:00 [python3] <defunct>
Check Process Resource Limits
Display detailed resource information:
$ ps -eo pid,vsz,rss,pmem,pcpu,comm --sort=-%mem | head -10

# Output
    PID    VSZ   RSS %MEM %CPU COMMAND
   1234 456789 98765  4.8  2.1 chrome
   1567 234567 67890  3.3  1.5 firefox
   1789 123456 45678  2.2  0.8 code
Performance Considerations
When using ps in scripts or frequent monitoring:
- Use specific options to limit output size
- Avoid complex sorting on large systems
- Consider
/procfilesystem for high-frequency monitoring - Use
pgrepinstead ofps | grepfor better performance
Alternative Commands and Tools
While ps is essential, consider these alternatives for specific use cases:
- top/htop: Real-time process monitoring
- pgrep/pkill: Find/kill processes by name
- systemctl: Manage systemd services
- lsof: List open files and processes
- netstat: Network connections and processes
Best Practices and Tips
- Use appropriate options: Choose between
auxand-efbased on the information you need - Combine with other tools: Leverage
grep,sort, andawkfor powerful filtering - Script automation: Use
psin monitoring scripts for automated system management - Understand output: Learn to interpret process states and resource usage columns
- Security awareness: Some process information may be sensitive; use appropriate permissions
Conclusion
The ps command is an indispensable tool for Linux system administration and process management. From basic process listing to complex system monitoring, mastering its various options and combinations with other commands will significantly enhance your Linux proficiency.
Whether you’re troubleshooting performance issues, monitoring system resources, or automating process management tasks, the ps command provides the foundation for effective process control in Linux environments. Practice these examples and incorporate them into your daily workflow to become more efficient in managing Linux systems.

