What is the Linux /proc Filesystem?
The /proc filesystem is a virtual filesystem in Linux that provides a window into the kernel’s internal data structures and running processes. Unlike traditional filesystems that store data on disk, /proc exists entirely in memory and acts as an interface between user space and kernel space, offering real-time information about system state, hardware configuration, and process details.
This pseudo-filesystem is mounted automatically at boot time and contains directories numbered by process IDs (PIDs) along with various system information files. Understanding /proc is crucial for system administrators, developers, and anyone working with Linux systems for monitoring, debugging, and system optimization.
Key Characteristics of /proc Filesystem
- Virtual Nature: Files exist only in memory, not on disk
- Dynamic Content: Information updates in real-time
- Read-only Access: Most files are read-only for security
- Kernel Interface: Direct access to kernel data structures
- Process Information: Detailed data about running processes
Essential /proc Directory Structure
Let’s explore the main components of the /proc filesystem with practical examples:
Process-Specific Directories
Each running process has a directory named after its PID:
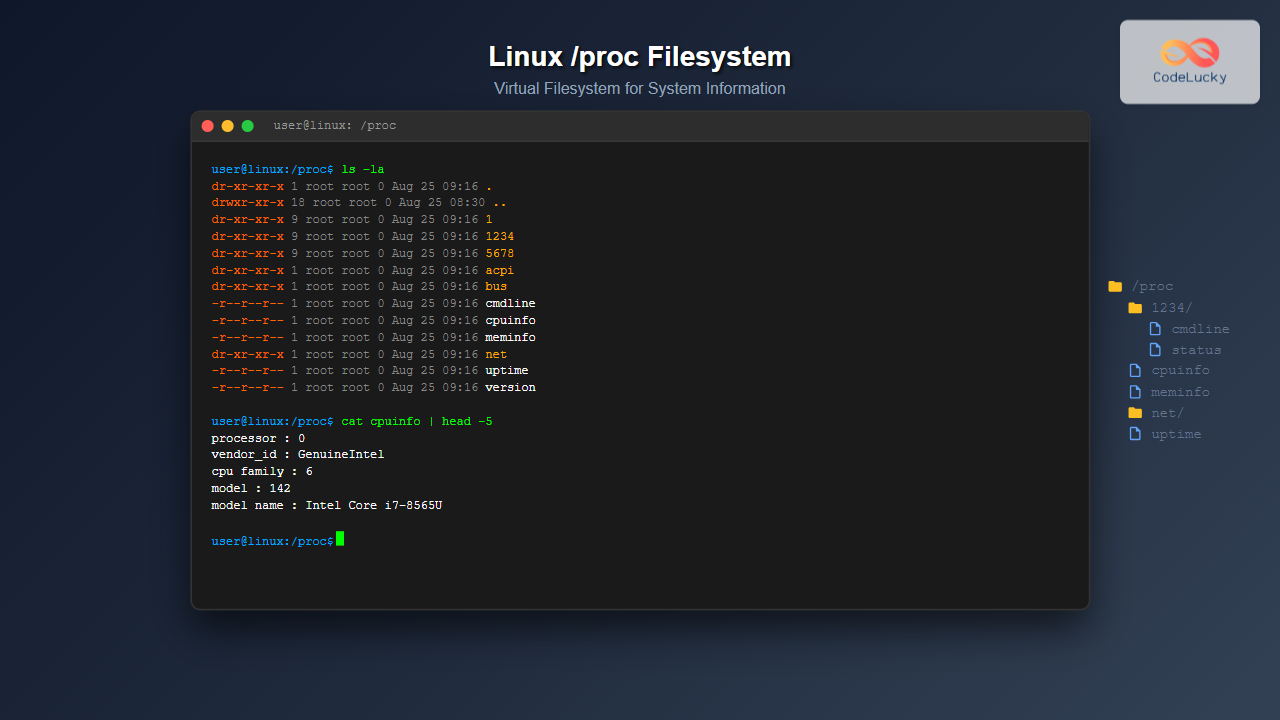
$ ls -la /proc/ | head -10
total 0
dr-xr-xr-x  1 root root 0 Aug 25 09:16 .
drwxr-xr-x 18 root root 0 Aug 25 08:30 ..
dr-xr-xr-x  9 root root 0 Aug 25 09:16 1
dr-xr-xr-x  9 root root 0 Aug 25 09:16 2
dr-xr-xr-x  9 root root 0 Aug 25 09:16 3
dr-xr-xr-x  9 root root 0 Aug 25 09:16 1234
dr-xr-xr-x  9 root root 0 Aug 25 09:16 5678
dr-xr-xr-x  1 root root 0 Aug 25 09:16 acpi
dr-xr-xr-x  1 root root 0 Aug 25 09:16 bus
System Information Files
Key system files provide hardware and kernel information:
$ ls -la /proc/ | grep "^-"
-r--r--r-- 1 root root 0 Aug 25 09:16 cmdline
-r--r--r-- 1 root root 0 Aug 25 09:16 cpuinfo
-r--r--r-- 1 root root 0 Aug 25 09:16 meminfo
-r--r--r-- 1 root root 0 Aug 25 09:16 uptime
-r--r--r-- 1 root root 0 Aug 25 09:16 version
-r--r--r-- 1 root root 0 Aug 25 09:16 loadavg
Important /proc Files and Their Usage
/proc/cpuinfo – CPU Information
Display detailed processor information:
$ cat /proc/cpuinfo | head -20
processor       : 0
vendor_id       : GenuineIntel
cpu family      : 6
model           : 142
model name      : Intel(R) Core(TM) i7-8565U CPU @ 1.80GHz
stepping        : 12
microcode       : 0xf0
cpu MHz         : 1800.000
cache size      : 8192 KB
physical id     : 0
siblings        : 8
core id         : 0
cpu cores       : 4
apicid          : 0
initial apicid  : 0
fpu             : yes
fpu_exception   : yes
cpuid level     : 22
wp              : yes
flags           : fpu vme de pse tsc msr pae mce
/proc/meminfo – Memory Information
Get comprehensive memory statistics:
$ cat /proc/meminfo | head -15
MemTotal:        8045532 kB
MemFree:         2156784 kB
MemAvailable:    5432156 kB
Buffers:          234567 kB
Cached:          2987654 kB
SwapCached:            0 kB
Active:          3456789 kB
Inactive:        1234567 kB
Active(anon):    2345678 kB
Inactive(anon):   567890 kB
Active(file):    1111111 kB
Inactive(file):   666777 kB
Unevictable:           0 kB
Mlocked:               0 kB
SwapTotal:       2097148 kB
/proc/uptime – System Uptime
$ cat /proc/uptime
87654.32 43210.16
The first number shows total uptime in seconds, the second shows idle time.
/proc/loadavg – System Load Average
$ cat /proc/loadavg
0.85 1.23 1.45 2/234 12345
Shows 1, 5, and 15-minute load averages, followed by running/total processes and last PID.
Process-Specific Information
Examining Individual Processes
Each process directory contains detailed information:
$ ls -la /proc/1234/
total 0
dr-xr-xr-x 9 user user 0 Aug 25 09:16 .
dr-xr-xr-x 1 root root 0 Aug 25 09:16 ..
-r--r--r-- 1 user user 0 Aug 25 09:16 cmdline
-r--r--r-- 1 user user 0 Aug 25 09:16 comm
lrwxrwxrwx 1 user user 0 Aug 25 09:16 cwd -> /home/user
-r-------- 1 user user 0 Aug 25 09:16 environ
lrwxrwxrwx 1 user user 0 Aug 25 09:16 exe -> /usr/bin/firefox
dr-x------ 2 user user 0 Aug 25 09:16 fd
-r--r--r-- 1 user user 0 Aug 25 09:16 maps
-r--r--r-- 1 user user 0 Aug 25 09:16 stat
-r--r--r-- 1 user user 0 Aug 25 09:16 status
Process Command Line
$ cat /proc/1234/cmdline
firefox--new-window
Process Status Information
$ cat /proc/1234/status | head -10
Name:   firefox
Umask:  0022
State:  S (sleeping)
Tgid:   1234
Ngid:   0
Pid:    1234
PPid:   987
TracerPid:      0
Uid:    1000    1000    1000    1000
Gid:    1000    1000    1000    1000
Network Information in /proc
/proc/net Directory
Network-related information is stored in /proc/net:
$ ls -la /proc/net/ | head -10
total 0
dr-xr-xr-x 1 root root 0 Aug 25 09:16 .
dr-xr-xr-x 1 root root 0 Aug 25 09:16 ..
-r--r--r-- 1 root root 0 Aug 25 09:16 arp
-r--r--r-- 1 root root 0 Aug 25 09:16 dev
-r--r--r-- 1 root root 0 Aug 25 09:16 netstat
-r--r--r-- 1 root root 0 Aug 25 09:16 route
-r--r--r-- 1 root root 0 Aug 25 09:16 tcp
-r--r--r-- 1 root root 0 Aug 25 09:16 udp
-r--r--r-- 1 root root 0 Aug 25 09:16 wireless
Network Device Statistics
$ cat /proc/net/dev
Inter-|   Receive                                                |  Transmit
 face |bytes    packets errs drop fifo frame compressed multicast|bytes    packets errs drop fifo colls carrier compressed
    lo: 1234567      890    0    0    0     0          0         0  1234567      890    0    0    0     0       0          0
  eth0: 9876543   123456    0    0    0     0          0      5432 8765432   111222    0    0    0     0       0          0
  wlan0: 5555555    77777    0    0    0     0          0      2222 4444444    66666    0    0    0     0       0          0
Hardware Information
Interrupt Information
$ cat /proc/interrupts | head -10
           CPU0       CPU1       CPU2       CPU3
  0:         23          0          0          0   IO-APIC   2-edge      timer
  1:          9          0          0          0   IO-APIC   1-edge      i8042
  8:          1          0          0          0   IO-APIC   8-edge      rtc0
  9:          0          0          0          0   IO-APIC   9-fasteoi   acpi
 12:        155          0          0          0   IO-APIC  12-edge      i8042
 16:      32456          0          0          0   IO-APIC  16-fasteoi   ehci_hcd:usb1
 23:    1234567          0          0          0   IO-APIC  23-fasteoi   ehci_hcd:usb2
 24:     567890          0          0          0   PCI-MSI 512000-edge      ahci[0000:00:1f.2]
 25:    9876543          0          0          0   PCI-MSI 327680-edge      xhci_hcd
I/O Port Information
$ cat /proc/ioports | head -10
0000-0cf7 : PCI Bus 0000:00
  0000-001f : dma1
  0020-0021 : pic1
  0040-0043 : timer0
  0050-0053 : timer1
  0060-0060 : keyboard
  0064-0064 : keyboard
  0070-0077 : rtc0
  0080-008f : dma page reg
  00a0-00a1 : pic2
File Descriptors and Process Resources
Examining Open File Descriptors
$ ls -la /proc/1234/fd/
total 0
dr-x------ 2 user user  0 Aug 25 09:16 .
dr-xr-xr-x 9 user user  0 Aug 25 09:16 ..
lrwx------ 1 user user 64 Aug 25 09:16 0 -> /dev/pts/0
lrwx------ 1 user user 64 Aug 25 09:16 1 -> /dev/pts/0
lrwx------ 1 user user 64 Aug 25 09:16 2 -> /dev/pts/0
lrwx------ 1 user user 64 Aug 25 09:16 3 -> /home/user/document.txt
lrwx------ 1 user user 64 Aug 25 09:16 4 -> socket:[12345]
Memory Maps
$ cat /proc/1234/maps | head -5
00400000-0040b000 r-xp 00000000 08:01 1234567  /usr/bin/firefox
0060a000-0060b000 r--p 0000a000 08:01 1234567  /usr/bin/firefox
0060b000-0060c000 rw-p 0000b000 08:01 1234567  /usr/bin/firefox
0060c000-0062d000 rw-p 00000000 00:00 0        [heap]
7f1234567000-7f1234689000 r-xp 00000000 08:01 7890123  /lib64/libc-2.17.so
System Performance Monitoring
/proc/stat – System Statistics
$ cat /proc/stat | head -10
cpu  123456 7890 234567 8901234 567890 0 12345 0 0 0
cpu0 30864 1972 58443 2225421 141953 0 3086 0 0 0
cpu1 30864 1972 58443 2225421 141953 0 3086 0 0 0
cpu2 30864 1972 58443 2225421 141953 0 3086 0 0 0
cpu3 30864 1972 58443 2225421 141953 0 3086 0 0 0
intr 12345678 23 0 0 0 0 0 0 0 1 0 0 0 155 0 0 32456
ctxt 87654321
btime 1692950400
processes 456789
procs_running 2
/proc/vmstat – Virtual Memory Statistics
$ cat /proc/vmstat | head -15
nr_free_pages 539196
nr_zone_inactive_anon 123456
nr_zone_active_anon 234567
nr_zone_inactive_file 345678
nr_zone_active_file 456789
nr_zone_unevictable 0
nr_zone_write_pending 123
nr_mlock 0
nr_page_table_pages 12345
nr_kernel_stack 6789
nr_bounce 0
nr_zspages 0
nr_free_cma 0
numa_hit 123456789
numa_miss 0
Practical Applications and Use Cases
System Monitoring Scripts
Create a simple system monitor using /proc:
#!/bin/bash
# Simple system monitor using /proc

echo "=== System Information ==="
echo "Uptime: $(cat /proc/uptime | cut -d' ' -f1) seconds"
echo "Load Average: $(cat /proc/loadavg | cut -d' ' -f1-3)"
echo "CPU Model: $(grep 'model name' /proc/cpuinfo | head -1 | cut -d: -f2)"

echo -e "\n=== Memory Usage ==="
awk '/MemTotal|MemFree|MemAvailable/ {print $1 ": " $2 " kB"}' /proc/meminfo

echo -e "\n=== Top 5 Processes by PID ==="
ls -1 /proc/[0-9]* | head -5 | while read pid; do
    if [ -r "$pid/comm" ]; then
        echo "PID $(basename $pid): $(cat $pid/comm 2>/dev/null)"
    fi
done
Process Monitoring
Monitor specific process resource usage:
#!/bin/bash
# Monitor process resource usage

PID=$1
if [ -z "$PID" ]; then
    echo "Usage: $0 "
    exit 1
fi

if [ ! -d "/proc/$PID" ]; then
    echo "Process $PID not found"
    exit 1
fi

echo "Process Information for PID: $PID"
echo "Command: $(cat /proc/$PID/comm)"
echo "Status: $(grep State /proc/$PID/status | cut -d: -f2)"
echo "Memory Usage:"
grep -E "VmSize|VmRSS|VmData" /proc/$PID/status
echo "CPU Usage: $(grep cpu /proc/$PID/stat | cut -d' ' -f14-15)"
Security Considerations
Access Permissions
The /proc filesystem has built-in security mechanisms:
- Process Isolation: Users can only access their own process directories
- Sensitive Information: Some files require root privileges
- Read-only Nature: Most files are read-only to prevent tampering
Hidepid Mount Option
Configure process visibility with hidepid:
# Mount /proc with restricted visibility
mount -o remount,hidepid=2 /proc

# View current mount options
mount | grep proc
proc on /proc type proc (rw,nosuid,nodev,noexec,relatime,hidepid=2)
Advanced /proc Usage
Kernel Parameters via /proc/sys
View and modify kernel parameters:
$ cat /proc/sys/kernel/hostname
localhost.localdomain

$ cat /proc/sys/net/ipv4/ip_forward
0

$ cat /proc/sys/vm/swappiness
60
Module Information
$ cat /proc/modules | head -5
nvidia 12345678 45 - Live 0xffffffffa0123000 (POE)
snd_hda_intel 87654 3 - Live 0xffffffffa0456000
snd_hda_codec 123456 1 snd_hda_intel, Live 0xffffffffa0789000
snd_hwdep 12345 1 snd_hda_codec, Live 0xffffffffa0abc000
snd_pcm 123456 2 snd_hda_intel,snd_hda_codec, Live 0xffffffffa0def000
Troubleshooting with /proc
Identifying System Issues
Use /proc for system troubleshooting:
# Check for high load
$ cat /proc/loadavg
2.85 3.23 3.45 3/234 12345

# Identify memory pressure
$ grep -E "MemFree|MemAvailable|SwapFree" /proc/meminfo
MemFree:          123456 kB
MemAvailable:     234567 kB
SwapFree:         345678 kB

# Find processes with high file descriptor usage
$ ls /proc/*/fd 2>/dev/null | wc -l
Network Troubleshooting
# Check network connections
$ cat /proc/net/tcp | head -3
  sl  local_address rem_address   st tx_queue rx_queue tr tm->when retrnsmt   uid  timeout inode
   0: 00000000:0016 00000000:0000 0A 00000000:00000000 00:00000000 00000000     0        0 12345 1 0000000000000000 100 0 0 10 0
   1: 0100007F:0277 00000000:0000 0A 00000000:00000000 00:00000000 00000000     0        0 23456 1 0000000000000000 100 0 0 10 0

# Monitor network interface statistics
$ watch -n 1 'cat /proc/net/dev'
Best Practices for Using /proc
Performance Considerations
- Avoid Frequent Polling: Don’t read /proc files too frequently
- Use Specific Files: Read only the information you need
- Handle Errors: Process directories can disappear suddenly
- Parse Carefully: File formats may change between kernel versions
Scripting Guidelines
#!/bin/bash
# Good practices for /proc scripting

# Check if process exists before accessing
check_process() {
    local pid=$1
    if [ ! -d "/proc/$pid" ]; then
        echo "Process $pid not found" >&2
        return 1
    fi
    return 0
}

# Safe file reading with error handling
safe_read() {
    local file=$1
    if [ -r "$file" ]; then
        cat "$file" 2>/dev/null
    else
        echo "Cannot read $file" >&2
        return 1
    fi
}
Conclusion
The Linux /proc filesystem is an invaluable tool for system administrators, developers, and power users who need deep insights into system behavior and process management. By understanding its structure and learning to navigate its various files and directories, you can effectively monitor system performance, troubleshoot issues, and gain detailed information about running processes.
Whether you’re debugging application issues, monitoring system resources, or developing system administration scripts, mastering the /proc filesystem will significantly enhance your Linux expertise. Remember to always consider security implications and follow best practices when accessing process information, especially in production environments.
The knowledge gained from this comprehensive guide will serve as a foundation for advanced system administration tasks and help you become more proficient in Linux system management and troubleshooting.

