System crashes are inevitable in the world of computing, but the real challenge lies in understanding why they occurred and preventing future incidents. Post-mortem analysis is the systematic process of investigating system failures after they happen, providing crucial insights that help maintain system stability and reliability.
Understanding Post-mortem Analysis
Post-mortem analysis, also known as failure analysis or crash investigation, is the methodical examination of a system failure to determine its root cause. This process involves collecting, analyzing, and interpreting various types of system data to reconstruct the events leading up to a crash.
Key Components of System Crash Investigation
Every effective post-mortem analysis relies on several critical data sources:
- System Logs: Kernel messages, application logs, and event records
- Memory Dumps: Complete system memory snapshots at crash time
- Core Files: Process-specific memory dumps
- Performance Metrics: CPU, memory, and I/O statistics
- Configuration Files: System and application settings
Types of System Crashes
Understanding different crash types helps determine the appropriate investigation approach:
Kernel Panics
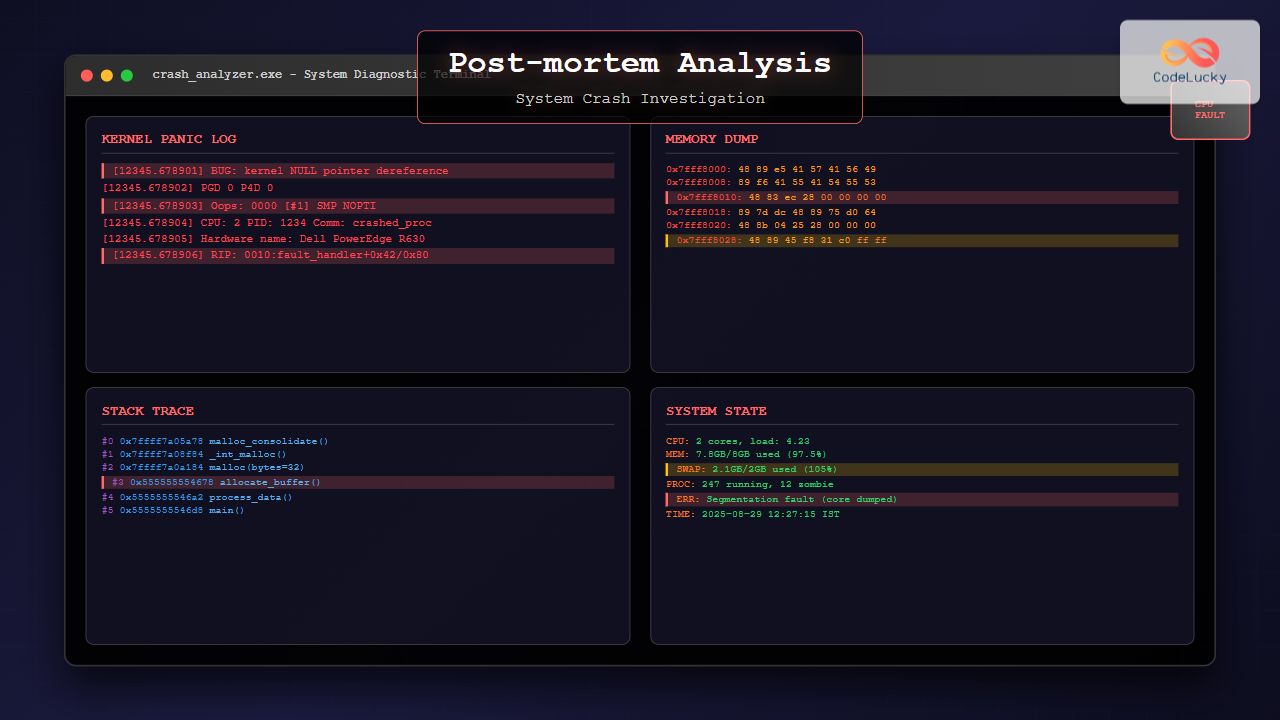
Kernel panics occur when the operating system kernel encounters an unrecoverable error. These are among the most serious system failures.
[12345.678901] BUG: kernel NULL pointer dereference at 0000000000000008
[12345.678902] PGD 0 P4D 0
[12345.678903] Oops: 0000 [#1] SMP NOPTI
[12345.678904] CPU: 2 PID: 1234 Comm: problematic_app Tainted: G W 5.4.0-42-generic #46-Ubuntu
[12345.678905] Hardware name: Dell Inc. PowerEdge R630/02C2CP, BIOS 2.12.0 06/02/2020
[12345.678906] RIP: 0010:problematic_function+0x42/0x80
Application Crashes
Application-level crashes typically generate segmentation faults, access violations, or unexpected terminations.
Program received signal SIGSEGV, Segmentation fault.
0x00007ffff7a05a78 in malloc_consolidate (av=av@entry=0x7ffff7dd1b60 <main_arena>) at malloc.c:4165
4165    malloc.c: No such file or directory.
(gdb) bt
#0  0x00007ffff7a05a78 in malloc_consolidate (av=av@entry=0x7ffff7dd1b60 <main_arena>) at malloc.c:4165
#1  0x00007ffff7a08f84 in _int_malloc (av=av@entry=0x7ffff7dd1b60 <main_arena>, bytes=bytes@entry=32) at malloc.c:3491
#2  0x00007ffff7a0a184 in __GI___libc_malloc (bytes=32) at malloc.c:2902
#3  0x0000555555554678 in main () at crash_example.c:12
System Hangs
System hangs occur when processes become unresponsive, often due to deadlocks or infinite loops.
Essential Tools for Crash Investigation
Linux Investigation Tools
GDB (GNU Debugger) is fundamental for analyzing core dumps and debugging applications:
# Load core dump for analysis
gdb ./program core.12345

# Basic GDB commands for crash analysis
(gdb) bt              # Show backtrace
(gdb) info registers  # Display CPU registers
(gdb) x/10i $rip      # Examine instructions around crash point
(gdb) print variable  # Examine variable values
(gdb) info threads    # Show all threads
Crash Utility provides comprehensive kernel crash analysis:
# Analyze kernel crash dump
crash vmlinux vmcore

# Useful crash commands
crash> bt                    # Kernel stack trace
crash> ps                    # Process list at crash time
crash> kmem -i               # Memory usage information
crash> mount                 # Mounted filesystems
crash> log                   # Kernel log messages
crash> dis -l kernel_function # Disassemble function
Windows Investigation Tools
WinDbg serves as the primary Windows debugging tool:
# Load dump file in WinDbg
.opendump C:\dumps\memory.dmp

# Essential WinDbg commands
!analyze -v              # Automated crash analysis
k                        # Display call stack
!process 0 0             # List all processes
!vm                      # Virtual memory usage
!locks                   # Display lock information
dt nt!_EPROCESS          # Display process structure
Memory Dump Analysis Techniques
Understanding Memory Layout
Effective crash investigation requires understanding how memory is organized at the time of failure.
Stack Trace Analysis
Stack traces provide the execution path leading to a crash:
# Example stack trace analysis
(gdb) bt full
#0  0x00007ffff7a05a78 in malloc_consolidate () at malloc.c:4165
        av = 0x7ffff7dd1b60 <main_arena>
        fb = <optimized out>
        maxfb = <optimized out>
#1  0x00007ffff7a08f84 in _int_malloc () at malloc.c:3491
        av = 0x7ffff7dd1b60 <main_arena>
        bytes = 32
        nb = 32
#2  0x00007ffff7a0a184 in malloc (bytes=32) at malloc.c:2902
#3  0x0000555555554678 in allocate_buffer (size=32) at main.c:45
        buffer = 0x0
#4  0x00005555555546a2 in process_data () at main.c:67
        data = 0x555555756260
#5  0x00005555555546d8 in main (argc=1, argv=0x7fffffffe458) at main.c:89
Memory Corruption Detection
Memory corruption is a common cause of system crashes. Key indicators include:
- Heap Corruption: Invalid free operations or buffer overflows
- Stack Corruption: Buffer overflows overwriting return addresses
- Use-After-Free: Accessing deallocated memory
- Double-Free: Attempting to free already freed memory
# Valgrind example for memory error detection
valgrind --tool=memcheck --leak-check=full ./program

==12345== Invalid write of size 1
==12345==    at 0x40053C: main (example.c:7)
==12345==  Address 0x5204040 is 0 bytes after a block of size 10 alloc'd
==12345==    at 0x4C2AB80: malloc (in /usr/lib/valgrind/vgpreload_memcheck-amd64-linux.so)
==12345==    by 0x400530: main (example.c:6)
Log Analysis Strategies
System Log Examination
System logs contain chronological records of system events and errors:
# Linux system log analysis
journalctl -xe --since "2025-08-29 00:00:00"
tail -f /var/log/syslog
grep -i "error\|panic\|segfault" /var/log/messages

# Windows Event Log analysis
Get-EventLog -LogName System -EntryType Error -After (Get-Date).AddDays(-1)
wevtutil qe System /f:text /rd:true /c:50
Application Log Correlation
Correlating application logs with system events provides comprehensive failure context:
# Multi-log correlation example
awk '/ERROR|FATAL|SEGV/ {print FILENAME":"FNR":"$0}' /var/log/app/*.log | sort -k1.20

# Timeline reconstruction
grep -h "2025-08-29 12:" /var/log/{syslog,app.log,kern.log} | sort -k1,2
Performance Analysis and Bottleneck Identification
Resource Utilization Monitoring
Performance bottlenecks often precede system crashes:
# CPU analysis
top -p PID
perf record -p PID -g -- sleep 30
perf report

# Memory analysis
pmap PID
cat /proc/PID/smaps
valgrind --tool=massif ./program

# I/O analysis
iotop -p PID
iostat -x 1
strace -p PID -e trace=file
Automated Crash Reporting Systems
Core Dump Configuration
Proper core dump configuration ensures crash data availability:
# Linux core dump configuration
echo "core.%e.%p.%t" > /proc/sys/kernel/core_pattern
ulimit -c unlimited
echo 'kernel.core_pattern = /var/crash/core.%e.%p.%t' >> /etc/sysctl.conf

# Systemd coredump configuration
echo "ProcessSizeMax=16G" >> /etc/systemd/coredump.conf
echo "ExternalSizeMax=16G" >> /etc/systemd/coredump.conf
systemctl restart systemd-coredump
Crash Monitoring Scripts
Automated monitoring helps capture crash data immediately:
#!/bin/bash
# Crash monitoring script example

CRASH_DIR="/var/crash"
LOG_FILE="/var/log/crash_monitor.log"

monitor_crashes() {
    while inotifywait -e create "$CRASH_DIR"; do
        TIMESTAMP=$(date '+%Y-%m-%d %H:%M:%S')
        echo "[$TIMESTAMP] New crash dump detected" >> "$LOG_FILE"

        # Collect system information
        uname -a >> "$LOG_FILE"
        free -h >> "$LOG_FILE"
        ps aux --sort=-%cpu | head -20 >> "$LOG_FILE"

        # Send notification
        mail -s "System Crash Detected" [email protected] < "$LOG_FILE"
    done
}

monitor_crashes &
Real-world Case Studies
Case Study 1: Memory Leak Investigation
A production server experienced gradual memory consumption leading to system crashes:
# Memory tracking over time
ps -eo pid,ppid,cmd,%mem,%cpu --sort=-%mem | head -10

# Detailed memory analysis
cat /proc/meminfo
pmap -x PID | tail -1
valgrind --tool=massif --time-unit=B ./suspicious_process

# Resolution
# Found: Unclosed file descriptors causing memory leaks
# Fix: Added proper resource cleanup in error handling paths
Case Study 2: Kernel Driver Bug
System experiencing random kernel panics during high I/O operations:
# Kernel crash analysis
crash vmlinux vmcore.001

crash> bt
PID: 0      TASK: ffffffff81e134c0  CPU: 2   COMMAND: "swapper/2"
 #0 [ffff88003fc03c48] machine_kexec at ffffffff81051beb
 #1 [ffff88003fc03ca8] __crash_kexec at ffffffff810f2542
 #2 [ffff88003fc03d78] crash_kexec at ffffffff810f2630
 #3 [ffff88003fc03d90] oops_end at ffffffff8164f448

# Investigation revealed driver race condition
# Fix: Added proper locking mechanism in driver code
Best Practices for Post-mortem Analysis
Documentation and Record Keeping
Comprehensive documentation ensures knowledge preservation and team collaboration:
- Incident Timeline: Chronological sequence of events
- Environmental Context: System configuration and load conditions
- Analysis Steps: Tools used and findings discovered
- Root Cause: Definitive cause identification
- Resolution: Steps taken to fix the issue
- Prevention: Measures to prevent recurrence
Team Collaboration
Effective post-mortem analysis requires collaboration across different expertise areas:
Preventive Measures
Post-mortem analysis should result in actionable prevention strategies:
- Code Reviews: Enhanced scrutiny of critical code sections
- Testing Improvements: Additional test cases covering failure scenarios
- Monitoring Enhancement: Better alerting and observability
- Configuration Management: Standardized and validated configurations
- Capacity Planning: Resource allocation based on usage patterns
Advanced Debugging Techniques
Dynamic Analysis Tools
Dynamic analysis provides runtime behavior insights:
# SystemTap for dynamic kernel analysis
stap -e 'probe kernel.function("sys_open") { printf("open: %s\n", user_string($filename)) }'

# DTrace for comprehensive system tracing (Solaris/macOS)
dtrace -n 'syscall:::entry { @[execname] = count(); }'

# ftrace for Linux kernel function tracing
echo function_graph > /sys/kernel/debug/tracing/current_tracer
echo 1 > /sys/kernel/debug/tracing/tracing_on
Static Analysis Integration
Combining static and dynamic analysis provides comprehensive coverage:
# Clang Static Analyzer
clang --analyze source_file.c

# Cppcheck for C/C++ analysis
cppcheck --enable=all --xml source_directory/

# PVS-Studio for commercial static analysis
pvs-studio-analyzer analyze --source-file source.cpp
Conclusion
Post-mortem analysis is an essential skill for maintaining robust computing systems. By combining systematic investigation techniques with the right tools and collaborative approaches, teams can effectively identify root causes, implement fixes, and prevent future incidents.
The key to successful crash investigation lies in preparation: having proper logging configured, crash dumps enabled, and monitoring systems in place before failures occur. Regular practice with debugging tools and maintaining comprehensive documentation ensures that when critical failures happen, teams can respond quickly and effectively.
Remember that every crash is an opportunity to improve system reliability. Through thorough post-mortem analysis, organizations can build more resilient systems and develop better engineering practices that prevent similar failures in the future.

