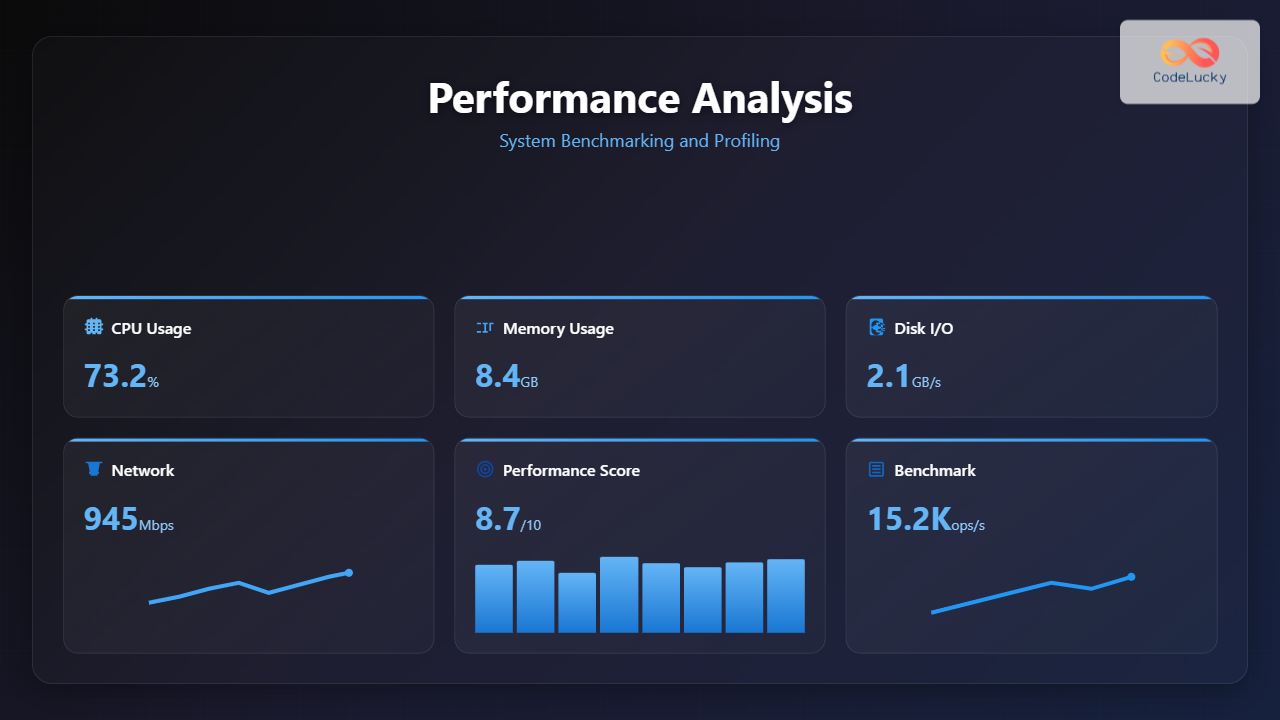
System performance analysis is the cornerstone of maintaining efficient computing environments. Whether you’re optimizing a web server, debugging application bottlenecks, or planning system upgrades, understanding benchmarking and profiling techniques is essential for making informed decisions about system performance.
Understanding Performance Analysis Fundamentals
Performance analysis involves two primary methodologies: benchmarking and profiling. Benchmarking provides standardized measurements to compare system performance against known baselines, while profiling identifies specific bottlenecks and resource utilization patterns within running applications.
System Benchmarking Methodologies
CPU Benchmarking
CPU benchmarking measures computational performance across different workload types. Modern processors exhibit varying performance characteristics depending on instruction types, cache usage, and thermal conditions.
Example: CPU Stress Testing with stress-ng
# Install stress-ng
sudo apt-get install stress-ng

# Run CPU benchmark for 60 seconds with all available cores
stress-ng --cpu 0 --cpu-method all --metrics --timeout 60s

# Sample output:
stress-ng: info:  [12345] dispatching hogs: 8 cpu
stress-ng: info:  [12345] cache allocate: default cache size: 8192K
stress-ng: info:  [12345] successful run completed in 60.02s
stress-ng: metrc: [12345] stressor       bogo ops real time  usr time  sys time   bogo ops/s   bogo ops/s
stress-ng: metrc: [12345]                           (secs)    (secs)    (secs)   (real time) (usr+sys time)
stress-ng: metrc: [12345] cpu              720000     60.02    479.23      0.41     12000.00     15000.31
Memory Benchmarking
Memory performance significantly impacts overall system responsiveness. Benchmarking memory involves testing both bandwidth and latency characteristics.
Example: Memory Bandwidth Testing
# Using mbw (Memory Bandwidth Benchmark)
sudo apt-get install mbw

# Test memory bandwidth with different block sizes
mbw -n 100 256

# Sample output:
AVG     Method: MEMCPY  Elapsed: 0.089   MiB: 256.00    Copy: 2880.371 MiB/s
AVG     Method: DUMB    Elapsed: 0.134   MiB: 256.00    Copy: 1913.432 MiB/s
AVG     Method: MCBLOCK Elapsed: 0.087   MiB: 256.00    Copy: 2943.182 MiB/s
Disk I/O Benchmarking
Storage performance testing reveals bottlenecks in read/write operations, which often become the limiting factor in data-intensive applications.
Example: Disk Performance with fio
# Install fio
sudo apt-get install fio

# Random read/write test
fio --name=randrw --ioengine=libaio --iodepth=1 --rw=randrw --bs=4k --direct=1 --size=512m --numjobs=2 --runtime=60 --group_reporting

# Sample output:
Jobs: 2 (f=2): [m(2)][100.0%][r=45.2MiB/s,w=15.1MiB/s][r=11.6k,w=3864 IOPS][eta 00m:00s]
randrw: (groupid=0, jobs=2): err= 0: pid=12346: Thu Aug 28 21:11:00 2025
  read: IOPS=11.6k, BW=45.2MiB/s (47.4MB/s)(2712MiB/60001msec)
  write: IOPS=3864, BW=15.1MiB/s (15.8MB/s)(904MiB/60001msec)
Application Profiling Techniques
CPU Profiling
CPU profiling identifies functions consuming the most processing time, enabling targeted optimization efforts.
Example: Using perf for CPU Profiling
# Profile a running application
sudo perf record -g ./my_application

# Generate report
perf report

# Sample output:
# Samples: 1K of event 'cycles:u', Event count (approx.): 123456789
# Children      Self  Command     Shared Object      Symbol
#   45.23%    45.23%  my_app      my_app            [.] heavy_computation
#   30.12%    30.12%  my_app      libc-2.31.so      [.] malloc
#   15.67%    15.67%  my_app      my_app            [.] data_processing
#    8.98%     8.98%  my_app      my_app            [.] main
Memory Profiling
Memory profiling reveals allocation patterns, memory leaks, and usage optimization opportunities.
Example: Valgrind Memory Analysis
# Install valgrind
sudo apt-get install valgrind

# Run memory profiling
valgrind --tool=massif ./my_application

# Generate memory usage graph
ms_print massif.out.12345

# Sample output:
    MB
11.80^                                                                      #
     |                                                                    @:#
     |                                                                @@@::#
     |                                                             @@@:::#
     |                                                        @@@@@::::#
     |                                                   @@@@@@:::::#
     |                                            @@@@@@@@::::::#
     |                                    @@@@@@@@@::::::::#
     |                          @@@@@@@@@@@:::::::::#
     |                 @@@@@@@@@@@::::::::::#
     |         @@@@@@@@@@:::::::::::::#
     |@@@@@@@@@@:::::::::::::::::#
   0 +--------------------------------------------------------------------->Gi
     0                                                                   113.5
Advanced Profiling Tools and Techniques
System-wide Performance Monitoring
Comprehensive system monitoring provides holistic performance insights across all system components.
Example: Using htop for Real-time Monitoring
# Install htop
sudo apt-get install htop

# Launch htop
htop

# Sample display interpretation:
#   CPU usage bars show individual core utilization
#   Memory bar indicates RAM usage vs available
#   Load average shows 1, 5, 15-minute averages
#   Process list sorted by CPU usage by default
Network Performance Profiling
Network profiling identifies bandwidth limitations, latency issues, and connection bottlenecks.
Example: Network Bandwidth Testing with iperf3
# Server side
iperf3 -s

# Client side
iperf3 -c server_ip -t 60

# Sample output:
Connecting to host 192.168.1.100, port 5201
[  5] local 192.168.1.101 port 54321 connected to 192.168.1.100 port 5201
[ ID] Interval           Transfer     Bitrate         Retr  Cwnd
[  5]   0.00-1.00   sec   112 MBytes   941 Mbits/sec    0    678 KBytes
[  5]   1.00-2.00   sec   110 MBytes   923 Mbits/sec   12    543 KBytes
[  5]   2.00-3.00   sec   113 MBytes   948 Mbits/sec    0    712 KBytes
Performance Optimization Strategies
Bottleneck Identification
Systematic bottleneck identification follows a methodical approach to isolate performance constraints.
Resource Utilization Analysis
Understanding resource utilization patterns enables proactive optimization and capacity planning.
Example: System Resource Analysis Script
#!/bin/bash
# performance_analysis.sh

echo "=== System Performance Analysis ==="
echo "Date: $(date)"
echo ""

# CPU Information
echo "CPU Usage:"
top -bn1 | grep "Cpu(s)" | awk '{print $2 $4}' | sed 's/%us,/% User, /' | sed 's/%sy/% System/'

# Memory Usage
echo ""
echo "Memory Usage:"
free -h | awk 'NR==2{printf "Memory: %s/%s (%.2f%%)\n", $3,$2,$3*100/$2 }'

# Disk Usage
echo ""
echo "Disk Usage:"
df -h | awk '$NF=="/"{printf "Disk: %d/%dGB (%s)\n", $3,$2,$5}'

# Load Average
echo ""
echo "Load Average:"
uptime | awk -F'load average:' '{ print $2 }'

# Top 5 CPU consuming processes
echo ""
echo "Top 5 CPU Consuming Processes:"
ps aux --sort=-%cpu | head -6

# Sample output:
# === System Performance Analysis ===
# Date: Thu Aug 28 21:11:00 IST 2025
#
# CPU Usage:
# 15.2% User, 3.1% System
#
# Memory Usage:
# Memory: 3.2G/8.0G (40.00%)
#
# Disk Usage:
# Disk: 45/100GB (45%)
#
# Load Average:
#  0.85, 0.92, 0.78
Continuous Performance Monitoring
Automated Monitoring Solutions
Implementing automated monitoring ensures consistent performance tracking and early issue detection.
Performance Regression Detection
Regular performance regression testing prevents performance degradation over time.
Example: Automated Benchmark Script
#!/bin/bash
# automated_benchmark.sh

RESULTS_DIR="/var/log/benchmarks"
DATE=$(date +%Y%m%d_%H%M%S)
BASELINE_FILE="$RESULTS_DIR/baseline.txt"

# Create results directory
mkdir -p $RESULTS_DIR

# Run CPU benchmark
echo "Running CPU benchmark..."
CPU_SCORE=$(stress-ng --cpu 1 --cpu-method int64 --metrics --timeout 30s | grep "bogo ops/s" | awk '{print $(NF-1)}')

# Run memory benchmark
echo "Running memory benchmark..."
MEM_SCORE=$(mbw -n 10 128 2>/dev/null | grep "MEMCPY" | awk '{print $NF}' | cut -d' ' -f1)

# Store results
echo "$DATE,CPU,$CPU_SCORE" >> "$RESULTS_DIR/benchmark_history.csv"
echo "$DATE,MEM,$MEM_SCORE" >> "$RESULTS_DIR/benchmark_history.csv"

# Compare with baseline
if [ -f "$BASELINE_FILE" ]; then
    BASELINE_CPU=$(grep "CPU" $BASELINE_FILE | cut -d',' -f3)
    BASELINE_MEM=$(grep "MEM" $BASELINE_FILE | cut -d',' -f3)

    CPU_DIFF=$(echo "scale=2; ($CPU_SCORE - $BASELINE_CPU) * 100 / $BASELINE_CPU" | bc)
    MEM_DIFF=$(echo "scale=2; ($MEM_SCORE - $BASELINE_MEM) * 100 / $BASELINE_MEM" | bc)

    echo "Performance Change from Baseline:"
    echo "CPU: ${CPU_DIFF}%"
    echo "Memory: ${MEM_DIFF}%"
else
    echo "BASELINE,CPU,$CPU_SCORE" > $BASELINE_FILE
    echo "BASELINE,MEM,$MEM_SCORE" >> $BASELINE_FILE
    echo "Baseline established"
fi
Best Practices for Performance Analysis
Testing Environment Considerations
Consistent testing environments ensure reliable and comparable performance measurements.
- Isolation: Run benchmarks on dedicated systems without competing processes
- Repeatability: Execute multiple test runs and calculate statistical averages
- Consistency: Maintain identical hardware and software configurations
- Documentation: Record system specifications and environmental conditions
Data Collection and Analysis
Systematic data collection enables trend analysis and informed decision-making.
Example: Performance Data Collection Script
#!/bin/bash
# collect_performance_data.sh

LOG_FILE="/var/log/performance/$(date +%Y%m%d).log"
INTERVAL=60  # seconds

mkdir -p /var/log/performance

while true; do
    TIMESTAMP=$(date '+%Y-%m-%d %H:%M:%S')

    # Collect CPU usage
    CPU_USAGE=$(top -bn1 | grep "Cpu(s)" | awk '{print $2}' | cut -d'%' -f1)

    # Collect memory usage
    MEM_USAGE=$(free | grep Mem | awk '{printf "%.1f", $3/$2 * 100.0}')

    # Collect disk usage
    DISK_USAGE=$(df / | tail -1 | awk '{print $5}' | cut -d'%' -f1)

    # Collect load average
    LOAD_AVG=$(uptime | awk -F'load average: ' '{print $2}' | cut -d',' -f1)

    # Log data
    echo "$TIMESTAMP,CPU:$CPU_USAGE,MEM:$MEM_USAGE,DISK:$DISK_USAGE,LOAD:$LOAD_AVG" >> $LOG_FILE

    sleep $INTERVAL
done

# Sample log output:
# 2025-08-28 21:11:00,CPU:15.2,MEM:38.4,DISK:45,LOAD:0.85
# 2025-08-28 21:12:00,CPU:12.8,MEM:39.1,DISK:45,LOAD:0.78
Conclusion
Effective performance analysis requires a combination of systematic benchmarking, detailed profiling, and continuous monitoring. By implementing the techniques and tools outlined in this guide, system administrators and developers can identify bottlenecks, optimize resource utilization, and maintain optimal system performance.
Regular performance analysis not only solves immediate performance issues but also provides valuable insights for capacity planning and system optimization. The key to successful performance analysis lies in establishing baseline measurements, implementing consistent monitoring practices, and using the right tools for specific performance challenges.
Remember that performance optimization is an iterative process. Start with identifying the most significant bottlenecks, implement targeted improvements, and measure the results. This methodical approach ensures that optimization efforts deliver maximum impact on overall system performance.

