
The perf command is one of the most powerful performance analysis tools available in Linux, offering comprehensive insights into system performance, CPU usage patterns, and application profiling. This versatile tool helps developers and system administrators identify performance bottlenecks, optimize code, and understand system behavior at a granular level.
What is the perf Command?
The perf command is a performance monitoring and analysis tool that leverages hardware performance counters and kernel tracepoints to provide detailed performance statistics. It’s part of the Linux kernel tools and offers both real-time monitoring and post-analysis capabilities for various performance metrics.
Key Features of perf
- CPU Performance Monitoring: Track CPU cycles, instructions, cache misses, and branch predictions
- Memory Analysis: Monitor memory access patterns and identify memory bottlenecks
- System-wide Profiling: Analyze entire system performance or specific processes
- Call Graph Generation: Create detailed function call hierarchies
- Event Tracing: Monitor kernel events and system calls
- Statistical Sampling: Perform statistical profiling with minimal overhead
Installing perf
Most Linux distributions include perf as part of their kernel tools package:
# Ubuntu/Debian
sudo apt-get install linux-tools-common linux-tools-generic

# CentOS/RHEL/Fedora
sudo yum install perf
# or for newer versions
sudo dnf install perf

# Arch Linux
sudo pacman -S perf
Basic perf Command Syntax
The general syntax for perf commands follows this pattern:
perf [command] [options] [program] [arguments]Common perf subcommands include:
stat– Display performance statisticsrecord– Record performance datareport– Analyze recorded datatop– Real-time performance monitoringlist– List available eventsannotate– Annotate source code with performance data
Essential perf Commands and Examples
1. perf stat – Performance Statistics
The perf stat command provides high-level performance statistics for a command or process:
# Basic statistics for a command
perf stat ls -la

# Example output:
Performance counter stats for 'ls -la':

       2.15 msec task-clock                #    0.891 CPUs utilized
          0      context-switches          #    0.000 K/sec
          0      cpu-migrations            #    0.000 K/sec
        156      page-faults               #    0.072 M/sec
  6,842,157      cycles                    #    3.181 GHz
  4,012,891      instructions              #    0.59  insn per cycle
    901,234      branches                  #  419.271 M/sec
     45,123      branch-misses             #    5.01% of all branches

    0.002414 seconds time elapsed
2. Monitoring Specific Events
You can monitor specific performance events using the -e option:
# Monitor cache misses
perf stat -e cache-misses,cache-references ./my_program
# Monitor multiple events
perf stat -e cycles,instructions,branches,branch-misses ./my_program
# Example output:
Performance counter stats for './my_program':
15,234,567 cycles
8,901,234 instructions # 0.58 insn per cycle
2,345,678 branches
123,456 branch-misses # 5.26% of all branches
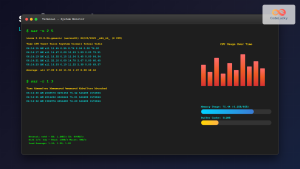
0.045123 seconds time elapsed3. perf top – Real-time Monitoring
The perf top command provides real-time performance monitoring similar to the top command:
# Real-time system-wide monitoring
sudo perf top

# Monitor specific process
sudo perf top -p [PID]

# Focus on specific events
sudo perf top -e cycles

# Example output display:
Samples: 1K of event 'cycles:ppp', Event count (approx.): 256410363
Overhead  Shared Object      Symbol
   8.25%  [kernel]          [k] __do_softirq
   6.12%  libc-2.31.so      [.] __memcpy_ssse3_back
   4.89%  [kernel]          [k] copy_user_enhanced_fast_string
   3.76%  firefox           [.] js::jit::MacroAssembler::branch32
   2.43%  [kernel]          [k] page_fault
4. perf record and perf report
Record performance data for later analysis:
# Record performance data
perf record -g ./my_program

# Record with specific events
perf record -e cycles,instructions -g ./my_program

# Record system-wide for 10 seconds
sudo perf record -a sleep 10

# Analyze recorded data
perf report

# Example perf report output:
# Samples: 2K of event 'cycles:ppp'
# Event count (approx.): 987654321
#
# Overhead  Command     Shared Object      Symbol
# ........  ..........  .................  ................................
#
    23.45%  my_program  my_program         [.] calculate_matrix
    18.76%  my_program  libc-2.31.so       [.] malloc
    12.34%  my_program  my_program         [.] process_data
     8.91%  my_program  libc-2.31.so       [.] memcpy
     6.78%  my_program  my_program         [.] main
5. Call Graph Profiling
Generate detailed call graphs to understand function relationships:
# Record with call graph information
perf record -g --call-graph dwarf ./my_program

# View call graph in report
perf report -g graph,0.5,caller

# Generate flame graph (requires additional tools)
perf script | stackcollapse-perf.pl | flamegraph.pl > flame.svg
Advanced perf Usage
1. Memory Profiling
Analyze memory usage patterns and identify memory-related performance issues:
# Monitor memory events
perf stat -e page-faults,cache-misses,cache-references ./my_program

# Record memory access patterns
perf record -e mem:0x600000:rw ./my_program

# Monitor specific memory events
perf record -e cpu/mem-loads,ldlat=30/P ./my_program
2. CPU-specific Monitoring
Monitor performance on specific CPU cores:
# Monitor specific CPU core
perf stat -C 0 sleep 5

# Record events on multiple cores
perf record -C 0,1,2,3 ./my_program

# Per-CPU analysis
perf stat -a -A sleep 5
3. Kernel Tracepoints
Monitor kernel events and system calls:
# List available tracepoints
perf list tracepoint

# Monitor system calls
perf record -e syscalls:sys_enter_openat ./my_program

# Monitor scheduler events
perf record -e sched:sched_switch -a sleep 5
Practical Examples
Example 1: Profiling a CPU-intensive Application
# Create a sample CPU-intensive program
cat > cpu_intensive.c << EOF
#include
#include

void expensive_calculation() {
    volatile long sum = 0;
    for (long i = 0; i < 100000000; i++) {
        sum += i * i;
    }
}

int main() {
    for (int i = 0; i < 10; i++) {
        expensive_calculation();
    }
    return 0;
}
EOF

# Compile the program
gcc -O2 -g cpu_intensive.c -o cpu_intensive

# Profile with perf
perf stat ./cpu_intensive

# Expected output:
Performance counter stats for './cpu_intensive':

      892.15 msec task-clock                #    0.999 CPUs utilized
           2      context-switches          #    0.002 K/sec
           0      cpu-migrations            #    0.000 K/sec
          51      page-faults               #    0.057 K/sec
 2,456,789,123      cycles                    #    2.754 GHz
 3,012,345,678      instructions              #    1.23  insn per cycle
   601,234,567      branches                  #  674.123 M/sec
        12,345      branch-misses             #    0.00% of all branches

    0.893456 seconds time elapsed
Example 2: Memory Access Pattern Analysis
# Create a memory-intensive program
cat > memory_test.c << EOF
#include
#include
#include

#define SIZE 1000000

int main() {
    int *array = malloc(SIZE * sizeof(int));

    // Sequential access
    for (int i = 0; i < SIZE; i++) {
        array[i] = i;
    }

    // Random access
    for (int i = 0; i < SIZE; i++) {
        int idx = rand() % SIZE;
        array[idx] = array[idx] + 1;
    }

    free(array);
    return 0;
}
EOF

# Compile and profile
gcc -O2 -g memory_test.c -o memory_test
perf stat -e cache-misses,cache-references,page-faults ./memory_test

# Expected output:
Performance counter stats for './memory_test':

       456,789      cache-misses              #   12.34 % of all cache refs
     3,701,234      cache-references
           234      page-faults

    0.123456 seconds time elapsed
perf Event Types
Hardware Events
# List hardware events
perf list hw

# Common hardware events:
# - cycles: CPU cycles
# - instructions: Instructions executed
# - cache-references: Cache accesses
# - cache-misses: Cache misses
# - branches: Branch instructions
# - branch-misses: Mispredicted branches
Software Events
# List software events
perf list sw

# Common software events:
# - cpu-clock: CPU clock timer
# - task-clock: Task clock timer
# - page-faults: Page faults
# - context-switches: Context switches
# - cpu-migrations: CPU migrations
Tracepoint Events
# List tracepoint events
perf list tracepoint | head -20

# Examples:
# - syscalls:sys_enter_read
# - sched:sched_switch
# - kmem:kmalloc
# - block:block_rq_issue
Performance Optimization Workflow
Step 1: Identify Hotspots
# Get overall statistics
perf stat ./my_application

# Identify top functions
perf record -g ./my_application
perf report --sort=overhead
Step 2: Detailed Analysis
# Analyze specific functions
perf annotate function_name

# Check cache behavior
perf stat -e cache-misses,cache-references ./my_application
Step 3: Monitor Improvements
# Compare before and after optimizations
perf stat -r 5 ./my_application_old
perf stat -r 5 ./my_application_new
Best Practices and Tips
1. Compile with Debug Information
Always compile your programs with debug information for better analysis:
gcc -g -O2 program.c -o program2. Use Appropriate Sampling Rates
Adjust sampling frequency based on your needs:
# High frequency sampling (more overhead)
perf record -F 999 ./program

# Lower frequency sampling (less overhead)
perf record -F 99 ./program
3. Focus on Relevant Metrics
Choose events that are relevant to your performance concerns:
# For CPU-bound applications
perf stat -e cycles,instructions,branches,branch-misses

# For memory-bound applications
perf stat -e cache-misses,cache-references,page-faults
4. Use Filters for Large Applications
Filter results to focus on your code:
# Filter by symbol
perf report --symbols=my_function

# Filter by shared object
perf report --dsos=my_program
Common Issues and Troubleshooting
Permission Issues
Some perf operations require elevated privileges:
# Temporary solution
sudo sysctl kernel.perf_event_paranoid=1

# Or run with sudo
sudo perf record -a ./program
Missing Symbols
Install debug symbols for better analysis:
# Ubuntu/Debian
sudo apt-get install libc6-dbg

# Enable debug symbols in reports
perf report --symfs=/usr/lib/debug
Conclusion
The perf command is an indispensable tool for performance analysis in Linux environments. From basic performance statistics to detailed profiling and call graph analysis, perf provides comprehensive insights into system and application performance. By mastering these commands and techniques, you can effectively identify bottlenecks, optimize code performance, and ensure your applications run efficiently.
Remember to start with basic profiling using perf stat, then dive deeper with perf record and perf report when you need detailed analysis. The key to effective performance optimization is understanding what metrics matter for your specific use case and using the appropriate perf tools to gather and analyze that data.
Related Posts
vmstat Command Linux: Monitor Virtual Memory and System Performance Statistics
The vmstat command is one of the most powerful and essential tools for Linux system administrators and developers to monitor...
getrlimit Command Linux: Complete Guide to System Resource Limits Management
The getrlimit system call in Linux is a fundamental tool for retrieving information about resource limits imposed on processes. Understanding...
iostat Command Linux: Complete Guide to Monitor Input Output Statistics and System Performance
The iostat command is an essential Linux system monitoring tool that provides detailed input/output statistics for devices and partitions. As...
ptrace Command Linux: Complete Guide to Process Tracing System Call
The ptrace system call is one of Linux's most powerful tools for process monitoring and debugging. It allows one process...
htop Command Linux: Complete Guide to Advanced Process Monitoring and Management
The htop command is an enhanced, interactive version of the traditional top command that provides real-time monitoring of system processes...
strace Advanced Linux: Complete Guide to System Call Tracing and Debugging
strace is one of the most powerful debugging and diagnostic tools available in Linux systems. It allows you to trace...
valgrind Command Linux: Complete Memory Debugging and Profiling Guide
Valgrind is one of the most powerful and essential tools for Linux developers and system administrators who need to debug...

top Command Linux: Complete Guide to Real-Time Process Monitoring
The top command is one of the most essential tools in a Linux system administrator's arsenal. It provides real-time information...
ltrace Command Linux: Complete Guide to Trace Library Calls and Debug Programs
The ltrace command is a powerful debugging and analysis tool in Linux that allows you to trace library calls made...
sar Command Linux: System Activity Reporter for Performance Monitoring
The sar (System Activity Reporter) command is one of the most powerful and comprehensive system monitoring tools available in Linux....
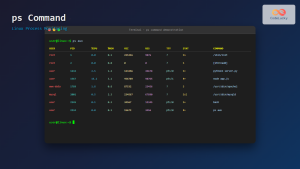
ps Command in Linux: Complete Guide to Process Monitoring and Management
The ps command is one of the most fundamental and powerful tools in Linux for displaying information about running processes....
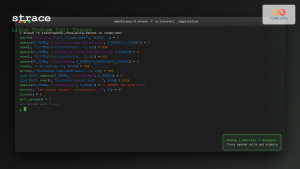
strace Command Linux: Complete Guide to System Call Tracing and Debugging
The strace command is one of the most powerful debugging and monitoring tools available in Linux systems. It allows you...


