
PandoraFMS is a comprehensive, open-source network monitoring platform that provides complete visibility into your IT infrastructure. This powerful monitoring solution runs natively on Linux systems and offers enterprise-grade features for monitoring networks, servers, applications, and services in real-time.
What is PandoraFMS?
PandoraFMS (Flexible Monitoring System) is a monitoring software that allows you to watch over your entire IT infrastructure from a single centralized console. It combines network monitoring, server monitoring, application monitoring, and log analysis into one unified platform.
Key Features of PandoraFMS
- Multi-platform Support: Monitors Windows, Linux, Unix, and network devices
- Scalable Architecture: Handles from small networks to enterprise environments
- Real-time Monitoring: Instant alerts and notifications
- Web-based Interface: Accessible from any web browser
- SNMP Support: Complete SNMP v1, v2c, and v3 monitoring
- Custom Plugins: Extensible with custom monitoring scripts
System Requirements for Linux Installation
Before installing PandoraFMS, ensure your Linux system meets the following requirements:
Minimum Hardware Requirements
CPU: Dual-core 2.4 GHz processor
RAM: 4 GB minimum (8 GB recommended)
Storage: 20 GB free disk space
Network: Ethernet connection
Software Requirements
- Linux distribution (CentOS 7/8, Ubuntu 18.04+, RHEL 7/8)
- Apache web server 2.4+
- MySQL 5.7+ or MariaDB 10.2+
- PHP 7.2+ with required modules
- Perl 5.10+ with DBI modules
Installing PandoraFMS on Linux
Let’s walk through the installation process step by step for Ubuntu and CentOS systems.
Ubuntu Installation
First, update your system and install required dependencies:
sudo apt update && sudo apt upgrade -y
sudo apt install wget curl software-properties-common -y
Add the PandoraFMS repository:
cd /tmp
wget https://firefly.pandorafms.org/pandorafms/utils/installer/pandora_install.sh
chmod +x pandora_install.sh
sudo ./pandora_install.sh
The installer will automatically configure all required components including Apache, MySQL, and PHP dependencies.
CentOS/RHEL Installation
For CentOS systems, first install the EPEL repository:
sudo yum install epel-release -y
sudo yum update -y
Download and run the PandoraFMS installer:
cd /tmp
curl -O https://firefly.pandorafms.org/pandorafms/utils/installer/pandora_install_centos.sh
chmod +x pandora_install_centos.sh
sudo ./pandora_install_centos.sh
Manual Installation from Source
For advanced users who prefer manual installation:
wget https://github.com/pandorafms/pandorafms/releases/download/v760/pandorafms_console-760.tar.gz
tar -xzf pandorafms_console-760.tar.gz
sudo mv pandora_console /var/www/html/
sudo chown -R www-data:www-data /var/www/html/pandora_console
Initial Configuration
Database Setup
Create the PandoraFMS database and user:
mysql -u root -p
CREATE DATABASE pandora;
CREATE USER 'pandora'@'localhost' IDENTIFIED BY 'your_secure_password';
GRANT ALL PRIVILEGES ON pandora.* TO 'pandora'@'localhost';
FLUSH PRIVILEGES;
EXIT;
Web Interface Configuration
Access the web installer by navigating to http://your-server-ip/pandora_console in your browser. The installation wizard will guide you through:
- Database connection settings
- Administrator account creation
- Initial system configuration
- License agreement acceptance
Configuration Files
Key configuration files and their locations:
# Main server configuration
/etc/pandora/pandora_server.conf

# Agent configuration
/etc/pandora/pandora_agent.conf

# Web console configuration
/var/www/html/pandora_console/include/config.php
Setting Up PandoraFMS Agents
PandoraFMS agents collect data from monitored systems and send it to the central server.
Installing Linux Agent
cd /tmp
wget https://firefly.pandorafms.org/pandorafms/utils/agent/pandorafms_agent_linux-7.0NG.tar.gz
tar -xzf pandorafms_agent_linux-7.0NG.tar.gz
cd unix
sudo ./pandora_agent_installer --install
Agent Configuration
Edit the agent configuration file:
sudo nano /etc/pandora/pandora_agent.confKey configuration parameters:
# Server IP address
server_ip 192.168.1.100

# Agent name
agent_name web-server-01

# Group assignment
group Servers

# Monitoring interval (seconds)
interval 300

# Enable debug mode
debug 1
Start the agent service:
sudo systemctl enable pandora_agent_daemon
sudo systemctl start pandora_agent_daemon
sudo systemctl status pandora_agent_daemon
Network Monitoring Configuration
SNMP Monitoring Setup
Configure SNMP monitoring for network devices:
- Navigate to Administration → Manage Agents → Create Agent
- Select SNMP as the agent type
- Configure SNMP parameters:
SNMP Version: v2c
Community: public
Port: 161
Timeout: 5 seconds
Network Discovery
Use PandoraFMS network discovery to automatically detect devices:
# CLI network discovery
/usr/share/pandora_server/util/recon_scripts/nmap-recon.sh 192.168.1.0/24
Creating Network Modules
Example configuration for monitoring network interface traffic:
module_begin
module_name Interface_eth0_in
module_type generic_data_inc
module_snmp_community public
module_snmp_agent 192.168.1.1
module_snmp_oid 1.3.6.1.2.1.2.2.1.10.2
module_unit bytes/sec
module_description Incoming traffic on eth0
module_end
Advanced Monitoring Features
Custom Plugin Development
Create custom monitoring scripts for specialized requirements:
#!/bin/bash
# Custom disk usage plugin
DISK_USAGE=$(df -h / | awk 'NR==2{print $5}' | cut -d'%' -f1)
echo ""
echo "Custom_Disk_Usage "
echo "generic_data "
echo "$DISK_USAGE"
echo "Root partition usage percentage "
echo " "Alert Configuration
Set up intelligent alerting based on thresholds:
- Go to Alerts → Alert Templates
- Create a new template with conditions:
- Warning: Value > 80
- Critical: Value > 95
- Recovery: Value < 75
- Configure notification methods (Email, SMS, Slack)
Performance Optimization
Optimize PandoraFMS performance for large environments:
# Increase MySQL performance
sudo nano /etc/mysql/mysql.conf.d/mysqld.cnf

# Add these optimizations
innodb_buffer_pool_size = 2G
query_cache_size = 256M
tmp_table_size = 256M
max_heap_table_size = 256M
Monitoring Dashboard Creation
Custom Dashboard Design
Create comprehensive monitoring dashboards:
- Navigate to Dashboards → Dashboard Builder
- Add widgets for:
- System status overview
- Network traffic graphs
- Critical alerts summary
- Top processes by resource usage
- Configure auto-refresh intervals
- Set user permissions and sharing options
Reporting and Analytics
Generate automated reports for management:
# CLI report generation
/usr/share/pandora_server/util/pandora_report.pl \
  --config /etc/pandora/pandora_server.conf \
  --report_id 1 \
  --output_dir /tmp/reports/
Troubleshooting Common Issues
Agent Connection Problems
Debug agent connectivity issues:
# Check agent logs
sudo tail -f /var/log/pandora/pandora_agent.log

# Test server connectivity
telnet your-server-ip 41121

# Verify configuration
sudo pandora_agent --test-config
Performance Issues
Monitor system resources and optimize:
# Check system resources
htop
iostat -x 1
netstat -tuln | grep :41121

# Optimize database
mysqlcheck -u pandora -p --optimize --all-databases
Web Interface Issues
Common web console troubleshooting:
# Check Apache error logs
sudo tail -f /var/log/apache2/error.log

# Verify PHP configuration
php -m | grep -E "(mysql|gd|curl|xml)"

# Check file permissions
sudo chown -R www-data:www-data /var/www/html/pandora_console
Security Best Practices
Securing PandoraFMS Installation
- Database Security: Use strong passwords and restrict database access
- SSL/TLS: Configure HTTPS for web interface access
- Firewall Rules: Limit access to monitoring ports (41121, 162)
- User Management: Implement role-based access control
- Regular Updates: Keep PandoraFMS and system components updated
Network Security Configuration
# Configure firewall rules
sudo ufw allow 80/tcp
sudo ufw allow 443/tcp
sudo ufw allow 41121/tcp
sudo ufw allow from 192.168.1.0/24 to any port 162
Integration with Other Tools
API Usage
Integrate PandoraFMS with external systems using the API:
curl -X POST \
  "http://your-server/pandora_console/include/api.php" \
  -d "op=get&op2=all_agents&return_type=json&apipass=your_api_password"
Third-party Integrations
- Grafana: Create advanced visualization dashboards
- Elasticsearch: Enhanced log analysis and search
- Nagios: Import existing Nagios configurations
- Zabbix: Migrate from Zabbix monitoring setups
Conclusion
PandoraFMS provides a robust, scalable solution for comprehensive network and system monitoring on Linux platforms. With its extensive feature set, flexible configuration options, and strong community support, it serves as an excellent choice for organizations seeking professional-grade monitoring capabilities without licensing costs.
The platform’s ability to monitor diverse environments, combined with its powerful alerting system and customizable dashboards, makes it suitable for everything from small business networks to large enterprise infrastructures. Regular maintenance, security updates, and proper configuration optimization ensure optimal performance and reliability.
By following this comprehensive guide, you’ll have a fully functional PandoraFMS installation capable of monitoring your entire IT infrastructure effectively. Remember to regularly review and update your monitoring configurations as your network grows and evolves.
Related Posts

Pandora Linux Network Monitoring: Complete Guide to Real-Time Traffic Analysis
Network monitoring has become a critical aspect of modern IT infrastructure management. Pandora Linux stands out as a powerful, open-source...

whatsup Linux: Complete Network Monitoring and System Administration Guide
whatsup is a powerful network monitoring and system administration tool for Linux that provides real-time insights into network connectivity, system...
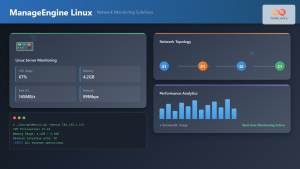
ManageEngine Linux: Complete Network Monitoring Solutions Guide
Network monitoring is crucial for maintaining optimal performance and security in Linux environments. ManageEngine provides powerful network monitoring solutions specifically...
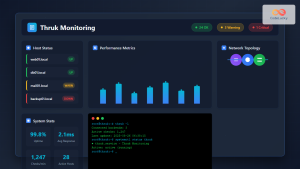
thruk Linux: Comprehensive Monitoring Web Interface for Network Infrastructure
Thruk is a powerful web-based monitoring interface designed primarily for Nagios and compatible monitoring systems. As a comprehensive frontend solution,...

Zenoss Linux: Complete Guide to IT Infrastructure Monitoring and Management
What is Zenoss and Why Use it on Linux? Zenoss is a powerful, open-source IT infrastructure monitoring platform that provides...
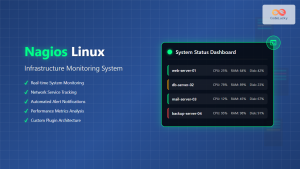
nagios Linux: Complete Infrastructure Monitoring System Setup Guide
Introduction to Nagios Nagios is one of the most popular open-source infrastructure monitoring systems available for Linux environments. Originally developed...
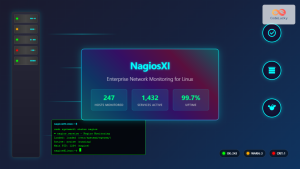
nagiosxi Linux: Complete Enterprise Network Monitoring Guide with Commands and Configuration
NagiosXI represents the pinnacle of enterprise network monitoring solutions on Linux systems, offering comprehensive infrastructure oversight with advanced alerting, reporting,...
op5 Linux: Complete Network Monitoring Solution Guide
op5 Linux is a comprehensive network monitoring solution built on top of the proven Nagios monitoring engine. This enterprise-grade platform...
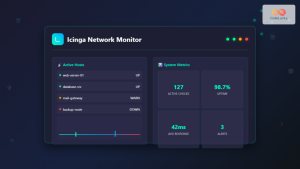
icinga Linux: Complete Network Monitoring System Guide for System Administrators
Icinga is a powerful open-source network monitoring system that helps system administrators monitor network resources, notify users of outages, and...
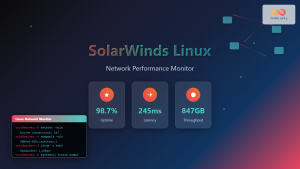
SolarWinds Linux: Complete Network Performance Monitor Guide for System Administrators
SolarWinds Network Performance Monitor (NPM) is a powerful network monitoring solution that provides comprehensive visibility into network infrastructure performance. While...
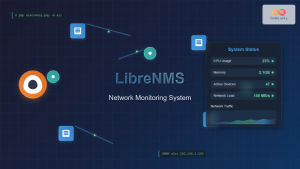
LibreNMS Linux: Complete Network Monitoring System Setup and Configuration Guide
LibreNMS is a powerful, open-source network monitoring platform that provides comprehensive visibility into network infrastructure. Built on PHP and MySQL,...
centreon Linux: Complete IT Infrastructure Monitoring Solution Guide
Centreon is a powerful, open-source IT infrastructure monitoring platform built on top of Nagios Core. It provides a comprehensive web-based...
- What is PandoraFMS?
- System Requirements for Linux Installation
- Installing PandoraFMS on Linux
- Initial Configuration
- Setting Up PandoraFMS Agents
- Network Monitoring Configuration
- Advanced Monitoring Features
- Monitoring Dashboard Creation
- Troubleshooting Common Issues
- Security Best Practices
- Integration with Other Tools
- Conclusion


