
Network monitoring has become a critical aspect of modern IT infrastructure management. Pandora Linux stands out as a powerful, open-source network monitoring solution that provides comprehensive visibility into network performance, traffic patterns, and security threats. This detailed guide will walk you through everything you need to know about implementing and utilizing Pandora for network monitoring on Linux systems.
What is Pandora Network Monitoring?
Pandora FMS (Flexible Monitoring System) is an enterprise-grade network monitoring platform designed for Linux environments. It offers real-time monitoring capabilities for networks, servers, applications, and services. The software combines network discovery, performance monitoring, and alerting mechanisms to provide administrators with complete network visibility.
Key Features of Pandora Network Monitoring
- Real-time Traffic Analysis: Monitor bandwidth usage, packet flows, and network protocols
- Automatic Network Discovery: Detect and map network devices automatically
- Performance Metrics: Track latency, throughput, and packet loss
- Alert Management: Configure custom alerts for network anomalies
- Reporting: Generate comprehensive network performance reports
- Multi-protocol Support: Monitor SNMP, WMI, TCP, UDP, and custom protocols
System Requirements and Prerequisites
Before installing Pandora on your Linux system, ensure your environment meets the following requirements:
Hardware Requirements
| Component | Minimum | Recommended |
|---|---|---|
| CPU | 2 cores 2.4 GHz | 4+ cores 3.0 GHz |
| RAM | 4 GB | 8+ GB |
| Storage | 20 GB | 100+ GB SSD |
Supported Linux Distributions
- Ubuntu 18.04 LTS or newer
- CentOS 7/8 or Rocky Linux 8+
- Red Hat Enterprise Linux 7/8+
- SUSE Linux Enterprise Server 12+
- Debian 9+ (Stretch or newer)
Installing Pandora Network Monitoring
The installation process varies depending on your Linux distribution. Here’s a comprehensive guide for the most common distributions:
Installation on Ubuntu/Debian
First, update your system and install required dependencies:
# Update system packages
sudo apt update && sudo apt upgrade -y

# Install required dependencies
sudo apt install -y wget curl apache2 mysql-server php php-mysql \
php-curl php-gd php-zip php-ldap php-snmp snmp snmp-mibs-downloader

# Download Pandora FMS
wget https://pandorafms.org/downloads/pandorafms_console-latest.tar.gz
wget https://pandorafms.org/downloads/pandorafms_server-latest.tar.gz

# Extract packages
tar -xzf pandorafms_console-latest.tar.gz
tar -xzf pandorafms_server-latest.tar.gz
Installation on CentOS/RHEL
# Install EPEL repository
sudo yum install -y epel-release

# Install required packages
sudo yum install -y httpd mariadb-server php php-mysql php-gd \
php-curl php-zip php-ldap net-snmp net-snmp-utils

# Enable and start services
sudo systemctl enable httpd mariadb
sudo systemctl start httpd mariadb

# Download and extract Pandora FMS
cd /tmp
wget https://pandorafms.org/downloads/pandorafms_console-latest.tar.gz
tar -xzf pandorafms_console-latest.tar.gz
Database Configuration
Pandora requires a MySQL/MariaDB database for storing monitoring data. Configure the database as follows:
# Secure MySQL installation
sudo mysql_secure_installation

# Create Pandora database
mysql -u root -p
CREATE DATABASE pandora;
CREATE USER 'pandora'@'localhost' IDENTIFIED BY 'your_secure_password';
GRANT ALL PRIVILEGES ON pandora.* TO 'pandora'@'localhost';
FLUSH PRIVILEGES;
EXIT;
Web Console Setup
The web console provides the graphical interface for managing Pandora network monitoring:
# Copy console files to web directory
sudo cp -r pandora_console /var/www/html/pandora

# Set proper permissions
sudo chown -R www-data:www-data /var/www/html/pandora
sudo chmod -R 755 /var/www/html/pandora

# Create configuration directory
sudo mkdir -p /etc/pandora
sudo chown www-data:www-data /etc/pandora
Server Configuration
Configure the Pandora server component for network monitoring:
# Install server components
cd pandora_server
sudo ./pandora_server_installer --install

# Edit main configuration file
sudo nano /etc/pandora/pandora_server.conf

# Key configuration parameters:
# servername pandora-server
# dbname pandora
# dbuser pandora
# dbpass your_secure_password
# dbhost 127.0.0.1
Network Discovery Configuration
One of Pandora’s most powerful features is automatic network discovery. Configure it to scan and identify devices on your network:
Basic Network Discovery Setup
# Create network discovery task
# Access Web Console -> Admin -> Servers -> Manage Servers -> Network Discovery

# Example discovery configuration:
Network: 192.168.1.0/24
SNMP Version: 2c
SNMP Community: public
Discovery Interval: 3600 (1 hour)
OS Detection: Enabled
Service Detection: Enabled
Advanced SNMP Configuration
For comprehensive network monitoring, configure SNMP properly:
# Edit SNMP configuration
sudo nano /etc/snmp/snmpd.conf

# Add community strings
rocommunity public 127.0.0.1
rocommunity monitoring 192.168.1.0/24

# Enable SNMP views for network monitoring
view systemonly included .1.3.6.1.2.1.1
view systemonly included .1.3.6.1.2.1.25.1
Monitoring Network Traffic
Pandora excels at real-time network traffic monitoring. Here’s how to set up comprehensive traffic analysis:
Interface Monitoring Setup
Monitor network interfaces for bandwidth utilization:
Interface: eth0
Status: Up
Speed: 1000 Mbps
Input Traffic: 45.2 Mbps (4.5% utilization)
Output Traffic: 23.8 Mbps (2.4% utilization)
Errors: 0
Discards: 0
Creating Custom Network Monitors
# Create bandwidth monitoring module
# Navigate to: Resources -> Manage Agents -> [Agent] -> Modules

Module Name: Interface_eth0_bandwidth
Module Type: Remote SNMP module
Target IP: 192.168.1.100
SNMP Community: public
SNMP OID: 1.3.6.1.2.1.2.2.1.10.2  # ifInOctets for interface 2
Execution Interval: 300 seconds
Setting Up Network Alerts
Proactive monitoring requires intelligent alerting. Configure alerts for network anomalies:
Bandwidth Threshold Alerts
# Create alert template
Alert Template Name: High_Bandwidth_Usage
Condition: Module value > 80000000  # 80 Mbps in bytes
Field 1: Interface name
Field 2: Current utilization
Action: Email notification + SNMP trap
Network Device Down Alert
- Trigger: Host unreachable for 2 consecutive checks
- Recovery: Host responds to ping
- Actions: Email, SMS, Slack notification
- Escalation: Manager notification after 15 minutes
Performance Optimization
Optimize Pandora for large-scale network monitoring:
Database Optimization
# Optimize MySQL for Pandora
sudo nano /etc/mysql/mysql.conf.d/mysqld.cnf

# Add optimization parameters:
innodb_buffer_pool_size = 2G
innodb_log_file_size = 256M
max_connections = 200
query_cache_size = 64M
tmp_table_size = 128M
Server Performance Tuning
# Edit Pandora server configuration
sudo nano /etc/pandora/pandora_server.conf

# Performance parameters:
max_queue_files 2000
server_threshold 30
network_timeout 5
snmp_timeout 3
thread_pool_size 5
Monitoring Dashboard Creation
Create comprehensive dashboards for network monitoring visualization:
Network Overview Dashboard
Build a dashboard containing:
- Network Map: Visual topology of monitored devices
- Bandwidth Graphs: Real-time traffic utilization
- Device Status: Up/down status of network equipment
- Top Talkers: Devices consuming most bandwidth
- Alert Summary: Current active alerts
Widget Type: Network Graph
Data Source: SNMP Interface Monitoring
Time Range: Last 24 hours
Refresh Rate: 300 seconds
Display Format: Line graph with fill
Colors: Blue (inbound), Red (outbound)
Network Security Monitoring
Leverage Pandora for network security monitoring and threat detection:
Intrusion Detection Setup
# Monitor suspicious network patterns
# Create modules for:
# - Port scan detection
# - Unusual traffic patterns
# - Failed authentication attempts
# - Bandwidth anomalies

Module: Port_Scan_Detection
Type: Log monitoring
Log File: /var/log/security
Pattern: "Port scan detected from"
Alert Threshold: 1 occurrence
Report Generation
Generate comprehensive network monitoring reports:
Automated Weekly Reports
- Network Utilization Summary: Average and peak bandwidth usage
- Device Availability: Uptime statistics for all monitored devices
- Performance Trends: Long-term performance analysis
- Alert Summary: All alerts triggered during the period
- Capacity Planning: Growth trends and recommendations
Troubleshooting Common Issues
SNMP Connectivity Problems
# Test SNMP connectivity
snmpwalk -v2c -c public 192.168.1.1 1.3.6.1.2.1.1.1

# Check SNMP service
sudo systemctl status snmpd

# Verify firewall rules
sudo ufw status
sudo firewall-cmd --list-all
High CPU Usage
Monitor and optimize Pandora server performance:
# Check Pandora processes
ps aux | grep pandora

# Monitor system resources
top -p $(pgrep pandora_server)

# Adjust monitoring intervals
# Increase polling intervals for non-critical monitors
# Reduce the number of concurrent threads
Best Practices for Network Monitoring
Monitoring Strategy
- Start Small: Begin with critical devices and expand gradually
- Baseline Performance: Establish normal operating parameters
- Implement Redundancy: Monitor from multiple points for accuracy
- Regular Maintenance: Clean old data and optimize database regularly
- Documentation: Maintain clear documentation of monitoring setup
Alert Management
- Set appropriate thresholds to minimize false positives
- Implement alert escalation procedures
- Use alert correlation to reduce noise
- Regular review and adjustment of alert rules
- Test alert delivery mechanisms regularly
Integration with Other Tools
Pandora can integrate with various third-party tools to enhance network monitoring capabilities:
Nagios Integration
# Import Nagios configurations
pandora_manage /etc/pandora/pandora_server.conf \
--import_nagios_config /etc/nagios/nagios.cfg
SIEM Integration
Forward Pandora alerts to SIEM systems for centralized security monitoring:
- Configure syslog forwarding for alerts
- Use SNMP traps for real-time event notification
- Export monitoring data via REST API
- Implement custom scripts for data formatting
Conclusion
Pandora Linux provides a comprehensive network monitoring solution that combines ease of use with enterprise-grade features. By following this detailed guide, you can implement robust network monitoring that provides visibility into network performance, security, and capacity planning needs.
The key to successful network monitoring with Pandora lies in proper initial configuration, gradual expansion of monitoring scope, and continuous optimization based on your specific network requirements. Regular maintenance, alert fine-tuning, and performance optimization ensure that your monitoring system remains effective and provides valuable insights into your network infrastructure.
Remember to regularly update Pandora to the latest version, maintain proper backup procedures, and continuously evaluate your monitoring strategy to adapt to changing network requirements and growth patterns.
Related Posts

PandoraFMS Linux: Complete Network Monitoring Platform Guide
PandoraFMS is a comprehensive, open-source network monitoring platform that provides complete visibility into your IT infrastructure. This powerful monitoring solution...
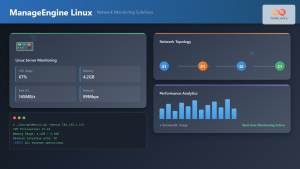
ManageEngine Linux: Complete Network Monitoring Solutions Guide
Network monitoring is crucial for maintaining optimal performance and security in Linux environments. ManageEngine provides powerful network monitoring solutions specifically...

whatsup Linux: Complete Network Monitoring and System Administration Guide
whatsup is a powerful network monitoring and system administration tool for Linux that provides real-time insights into network connectivity, system...

packetbeat Linux: Complete Network Packet Analysis Tool Guide
Network packet analysis is crucial for system administrators, security professionals, and developers who need to monitor, troubleshoot, and secure network...

iptraf Command Linux: Complete Interactive Network Monitoring Guide
The iptraf command is a powerful console-based network monitoring utility for Linux systems that provides real-time IP LAN monitoring capabilities....

Paessler Linux: Complete Guide to Network Monitoring with PRTG on Linux Systems
Network monitoring is crucial for maintaining optimal performance and security in Linux environments. Paessler PRTG Network Monitor offers comprehensive monitoring...
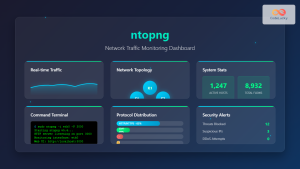
ntopng Command Linux: Complete Guide to Web-Based Network Traffic Monitoring
Network traffic monitoring is crucial for maintaining optimal network performance, security, and troubleshooting connectivity issues. The ntopng command provides a...

SolarWinds Linux: Complete Network Performance Monitor Guide for System Administrators
SolarWinds Network Performance Monitor (NPM) is a powerful network monitoring solution that provides comprehensive visibility into network infrastructure performance. While...
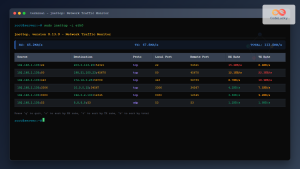
jnettop Command Linux: Monitor Real-Time Network Traffic by Connection
The jnettop command is a powerful Linux network monitoring tool that provides real-time visibility into network traffic organized by individual...

Zenoss Linux: Complete Guide to IT Infrastructure Monitoring and Management
What is Zenoss and Why Use it on Linux? Zenoss is a powerful, open-source IT infrastructure monitoring platform that provides...

thruk Linux: Comprehensive Monitoring Web Interface for Network Infrastructure
Thruk is a powerful web-based monitoring interface designed primarily for Nagios and compatible monitoring systems. As a comprehensive frontend solution,...
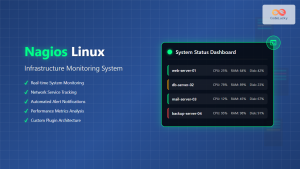
nagios Linux: Complete Infrastructure Monitoring System Setup Guide
Introduction to Nagios Nagios is one of the most popular open-source infrastructure monitoring systems available for Linux environments. Originally developed...


