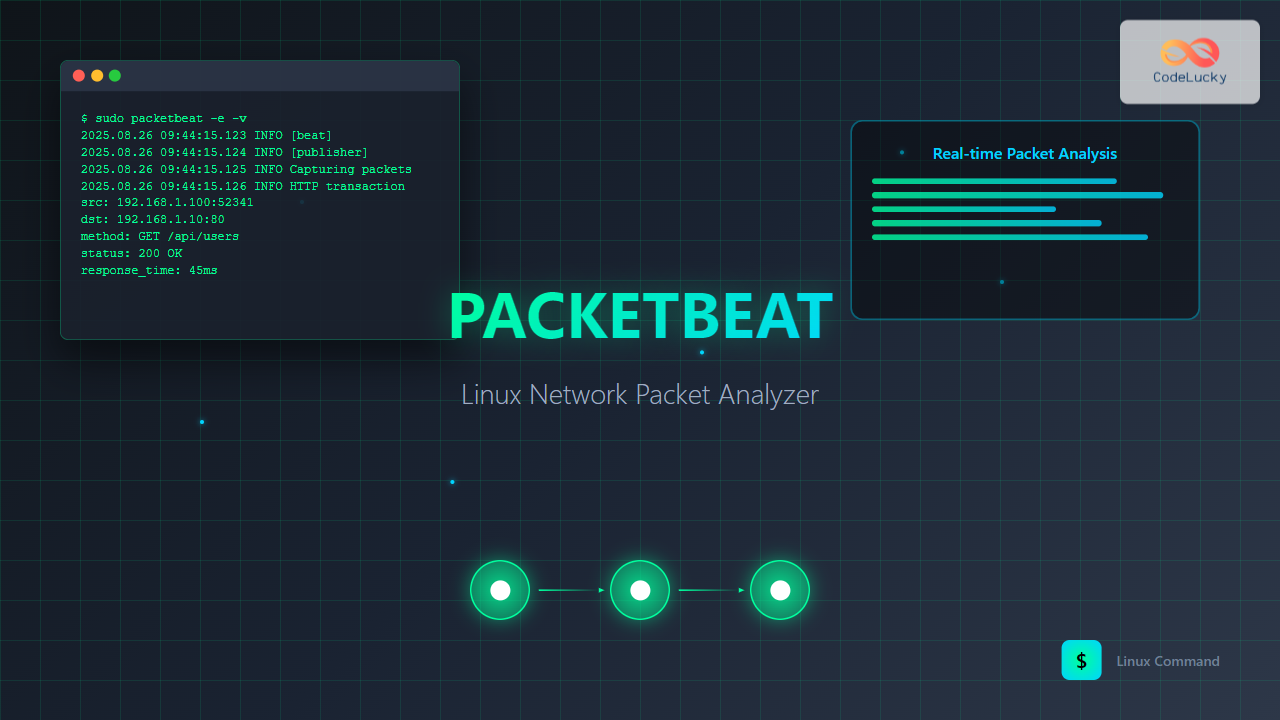
Network packet analysis is crucial for system administrators, security professionals, and developers who need to monitor, troubleshoot, and secure network communications. Packetbeat is a lightweight network packet analyzer that captures network traffic in real-time and sends the data to Elasticsearch or other outputs for analysis and visualization.
As part of the Elastic Stack (formerly ELK Stack), packetbeat provides deep insights into network protocols, application performance, and security threats. This comprehensive guide will walk you through everything you need to know about using packetbeat on Linux systems.
What is Packetbeat?
Packetbeat is an open-source network packet analyzer developed by Elastic. It operates as a lightweight shipper that captures network packets, analyzes protocols, and forwards structured data to various outputs including Elasticsearch, Logstash, or file systems.
Key Features of Packetbeat
- Real-time packet capture – Monitors network traffic as it happens
- Protocol analysis – Supports HTTP, MySQL, PostgreSQL, Redis, MongoDB, and more
- Low system overhead – Minimal impact on system performance
- Flexible output – Send data to multiple destinations
- Rich metadata – Extracts detailed information from network packets
- Geographic enrichment – Adds location data based on IP addresses
Installing Packetbeat on Linux
Installation via Package Manager
For Ubuntu/Debian systems:
# Add Elastic repository
wget -qO - https://artifacts.elastic.co/GPG-KEY-elasticsearch | sudo apt-key add -
echo "deb https://artifacts.elastic.co/packages/8.x/apt stable main" | sudo tee /etc/apt/sources.list.d/elastic-8.x.list

# Update package list and install
sudo apt update
sudo apt install packetbeat
For RHEL/CentOS/Fedora systems:
# Add Elastic repository
sudo rpm --import https://artifacts.elastic.co/GPG-KEY-elasticsearch

# Create repository file
cat << EOF | sudo tee /etc/yum.repos.d/elastic.repo
[elastic-8.x]
name=Elastic repository for 8.x packages
baseurl=https://artifacts.elastic.co/packages/8.x/yum
gpgcheck=1
gpgkey=https://artifacts.elastic.co/GPG-KEY-elasticsearch
enabled=1
autorefresh=1
type=rpm-md
EOF

# Install packetbeat
sudo yum install packetbeat
Manual Installation
You can also download and install packetbeat manually:
# Download the latest version
wget https://artifacts.elastic.co/downloads/beats/packetbeat/packetbeat-8.11.0-linux-x86_64.tar.gz

# Extract the archive
tar -xzf packetbeat-8.11.0-linux-x86_64.tar.gz

# Move to appropriate directory
sudo mv packetbeat-8.11.0-linux-x86_64 /opt/packetbeat

# Create symbolic link
sudo ln -s /opt/packetbeat/packetbeat /usr/local/bin/packetbeat
Basic Configuration
The main configuration file is located at /etc/packetbeat/packetbeat.yml. Let’s examine the key configuration sections:
Network Interface Configuration
# Configure which network interface to monitor
packetbeat.interfaces.device: any

# Set the snaplen (maximum packet size to capture)
packetbeat.interfaces.snaplen: 1514

# Buffer size in MB
packetbeat.interfaces.buffer_size_mb: 30
Protocol Configuration
Configure which protocols packetbeat should monitor:
packetbeat.protocols:
- type: http
  ports: [80, 8080, 8000, 5000, 8002]
  hide_keywords: ["pass", "password", "passwd"]

- type: mysql
  ports: [3306]

- type: redis
  ports: [6379]

- type: pgsql
  ports: [5432]
Output Configuration
Configure where to send the captured data:
# Elasticsearch output
output.elasticsearch:
  hosts: ["localhost:9200"]
  username: "elastic"
  password: "changeme"

# File output (for testing)
output.file:
  path: "/var/log/packetbeat"
  filename: packetbeat.log
Running Packetbeat
Starting Packetbeat Service
# Start packetbeat service
sudo systemctl start packetbeat

# Enable auto-start on boot
sudo systemctl enable packetbeat

# Check service status
sudo systemctl status packetbeat
Expected output:
● packetbeat.service - Packetbeat analyzes network traffic and sends the data to Elasticsearch
   Loaded: loaded (/lib/systemd/system/packetbeat.service; enabled; vendor preset: enabled)
   Active: active (running) since Tue 2025-08-26 09:44:15 IST; 2min 30s ago
     Docs: https://www.elastic.co/beats/packetbeat
 Main PID: 12345 (packetbeat)
   CGroup: /system.slice/packetbeat.service
           └─12345 /usr/share/packetbeat/bin/packetbeat -c /etc/packetbeat/packetbeat.yml
Running in Foreground (for testing)
# Run packetbeat in foreground with verbose output
sudo packetbeat -e -v -c /etc/packetbeat/packetbeat.yml
Practical Examples and Use Cases
Example 1: Monitoring HTTP Traffic
Configure packetbeat to capture HTTP requests and responses:
# HTTP protocol configuration
packetbeat.protocols:
- type: http
  ports: [80, 8080, 8000]
  include_body_for: ["application/json", "text/html"]
  max_message_size: 10485760
Sample HTTP transaction data captured by packetbeat:
{
  "@timestamp": "2025-08-26T04:14:15.123Z",
  "type": "http",
  "method": "GET",
  "path": "/api/users",
  "query": "GET /api/users",
  "status": "OK",
  "responsetime": 45,
  "bytes_in": 1024,
  "bytes_out": 2048,
  "client": {
    "ip": "192.168.1.100",
    "port": 52341
  },
  "server": {
    "ip": "192.168.1.10",
    "port": 80
  }
}
Example 2: Database Query Monitoring
Monitor MySQL database queries:
# MySQL protocol configuration
packetbeat.protocols:
- type: mysql
  ports: [3306]
  max_rows: 10
  max_row_length: 1024
Sample MySQL query data:
{
  "@timestamp": "2025-08-26T04:14:20.456Z",
  "type": "mysql",
  "method": "SELECT",
  "query": "SELECT * FROM users WHERE active = 1",
  "mysql": {
    "affected_rows": 150,
    "insert_id": 0,
    "num_fields": 5,
    "num_rows": 150
  },
  "status": "OK",
  "responsetime": 23
}
Example 3: Redis Command Monitoring
# Redis protocol configuration
packetbeat.protocols:
- type: redis
  ports: [6379]
Sample Redis command data:
{
  "@timestamp": "2025-08-26T04:14:25.789Z",
  "type": "redis",
  "method": "SET",
  "query": "SET user:1001 {\"name\": \"John Doe\"}",
  "redis": {
    "return_value": "OK"
  },
  "status": "OK",
  "responsetime": 2
}
Advanced Configuration Options
Flow Configuration
Configure network flow tracking:
packetbeat.flows:
  timeout: 30s
  period: 10s
Processors for Data Enhancement
processors:
- add_host_metadata:
    when.not.contains.tags: forwarded

- add_docker_metadata: ~

- add_kubernetes_metadata: ~

- drop_fields:
    fields: ["beat", "input_type", "offset"]
Geographic IP Enrichment
# Download GeoIP databases
sudo packetbeat setup --index-management

# Configure GeoIP processor
processors:
- add_locale: ~
- geoip:
    fields: ["client.ip", "server.ip"]
    target: "geoip"
Testing and Validation
Configuration Testing
# Test configuration file
sudo packetbeat test config -c /etc/packetbeat/packetbeat.yml

# Test output connectivity
sudo packetbeat test output -c /etc/packetbeat/packetbeat.yml
Expected output for successful test:
Config OK
elasticsearch: http://localhost:9200...
  parse url... OK
  connection...
    parse host... OK
    dns lookup... OK
    addresses: 127.0.0.1
    dial up... OK
  TLS... WARN secure connection disabled
  talk to server... OK
  version: 8.11.0
Generating Test Traffic
Create test HTTP traffic to verify packetbeat is working:
# Generate HTTP requests
curl -X GET http://localhost/api/test
curl -X POST http://localhost/api/users -d '{"name":"test"}'

# Generate MySQL traffic
mysql -h localhost -u root -p -e "SELECT * FROM information_schema.tables LIMIT 5;"
Monitoring and Troubleshooting
Log Analysis
Check packetbeat logs for issues:
# View system logs
sudo journalctl -u packetbeat -f

# Check packetbeat log files
sudo tail -f /var/log/packetbeat/packetbeat.log
Performance Monitoring
# Monitor system resources
htop
iostat -x 1

# Check network interface statistics
cat /proc/net/dev

# Monitor dropped packets
sudo packetbeat -e -v | grep "drop"
Common Issues and Solutions
| Issue | Cause | Solution |
|---|---|---|
| Permission denied | Insufficient privileges | Run with sudo or add user to pcap group |
| No packets captured | Wrong interface configuration | Set device to “any” or specific interface |
| High CPU usage | Too much traffic or wrong snaplen | Reduce snaplen or use filters |
| Connection refused | Elasticsearch not running | Start Elasticsearch service |
Best Practices and Security
Security Considerations
- User permissions – Run packetbeat with minimal required privileges
- Data filtering – Hide sensitive information like passwords
- Network segmentation – Monitor only necessary network segments
- Encryption – Use TLS for data transmission to Elasticsearch
Performance Optimization
# Optimize buffer sizes for high traffic
packetbeat.interfaces.buffer_size_mb: 100

# Use packet filtering
packetbeat.interfaces.bpf_filter: "host 192.168.1.10 and port 80"

# Limit protocols to monitor
packetbeat.protocols:
- type: http
  ports: [80, 443]
Data Retention and Storage
# Configure index lifecycle management
setup.ilm.enabled: true
setup.ilm.rollover_alias: "packetbeat"
setup.ilm.policy: "packetbeat-policy"
Integration with Elastic Stack
Kibana Visualization
Once data is flowing to Elasticsearch, you can create powerful visualizations in Kibana:
- Network topology maps – Visualize traffic flow between hosts
- Protocol dashboards – Monitor HTTP response times, database query performance
- Security analytics – Detect unusual network patterns
- Geographic visualizations – Map traffic by location
Setting up Kibana Dashboards
# Load sample dashboards
sudo packetbeat setup --dashboards

# Setup index templates
sudo packetbeat setup --index-management
Conclusion
Packetbeat is an essential tool for network monitoring, security analysis, and performance troubleshooting on Linux systems. Its lightweight design and powerful protocol analysis capabilities make it perfect for both small deployments and enterprise environments.
By following this guide, you now have the knowledge to install, configure, and effectively use packetbeat for comprehensive network analysis. Whether you’re monitoring web applications, database performance, or investigating security incidents, packetbeat provides the real-time network visibility you need.
Remember to regularly update your packetbeat installation, monitor system resources, and fine-tune configurations based on your specific network requirements. With proper setup and maintenance, packetbeat will serve as a valuable asset in your network monitoring toolkit.

