
op5 Linux is a comprehensive network monitoring solution built on top of the proven Nagios monitoring engine. This enterprise-grade platform provides organizations with powerful tools to monitor their IT infrastructure, ensuring optimal performance and minimizing downtime. In this detailed guide, we’ll explore everything you need to know about op5 Linux, from basic installation to advanced monitoring configurations.
What is op5 Linux?
op5 Linux is a commercial network monitoring distribution that combines the reliability of Nagios with enhanced user interfaces, advanced reporting capabilities, and streamlined configuration tools. Originally developed by op5 AB (now part of ITRS Group), this solution is designed for enterprises that require robust monitoring with professional support and additional features beyond what open-source alternatives provide.
Key Features of op5 Linux
- Nagios Core Integration: Built on the proven Nagios monitoring engine
- Web-based Configuration: Intuitive GUI for managing monitors and configurations
- Advanced Reporting: Comprehensive reporting and analytics capabilities
- Scalability: Supports monitoring thousands of hosts and services
- Mobile Support: Responsive web interface for mobile device access
- API Integration: REST API for third-party integrations
System Requirements
Before installing op5 Linux, ensure your system meets the following minimum requirements:
Hardware Requirements
- CPU: 64-bit processor (Intel/AMD)
- RAM: Minimum 4GB (8GB+ recommended)
- Storage: 20GB free disk space minimum
- Network: Ethernet connection
Software Requirements
- Operating System: CentOS 7/8, RHEL 7/8, or Ubuntu 18.04/20.04
- Database: MySQL/MariaDB or PostgreSQL
- Web Server: Apache HTTP Server
Installation Process
op5 Linux can be installed either as a complete appliance or as software packages on an existing Linux distribution. Here’s the step-by-step installation process:
Method 1: ISO Installation (Recommended)
The ISO installation provides a complete, pre-configured op5 Linux system:
# Download the op5 Linux ISO from the official website
# Create bootable media (USB/DVD)
# Boot from the installation media
# Follow the installation wizard

# Basic post-installation configuration
sudo op5-setup
Method 2: Package Installation on Existing Linux
For CentOS/RHEL systems:
# Add op5 repository
sudo yum install https://d2ubsrfrqwpk72.cloudfront.net/op5-repo-1.0-1.el7.noarch.rpm

# Install op5 packages
sudo yum install op5-monitor op5-reports

# Configure the system
sudo /opt/monitor/bin/op5_config_manager.py

# Start services
sudo systemctl enable httpd mariadb op5-monitor
sudo systemctl start httpd mariadb op5-monitor
For Ubuntu systems:
# Add repository key
wget -qO - https://d2ubsrfrqwpk72.cloudfront.net/op5.key | sudo apt-key add -

# Add repository
echo "deb https://d2ubsrfrqwpk72.cloudfront.net/ubuntu focal main" | sudo tee /etc/apt/sources.list.d/op5.list

# Update and install
sudo apt update
sudo apt install op5-monitor op5-reports

# Configure system
sudo /opt/monitor/bin/op5_config_manager.py
Initial Configuration
After installation, you’ll need to perform initial configuration to get op5 Linux running:
Database Setup
# Configure MySQL/MariaDB
sudo mysql_secure_installation

# Create op5 database
mysql -u root -p
CREATE DATABASE op5_monitor;
GRANT ALL PRIVILEGES ON op5_monitor.* TO 'op5'@'localhost' IDENTIFIED BY 'your_password';
FLUSH PRIVILEGES;
EXIT;

# Initialize op5 database schema
sudo /opt/monitor/bin/op5_db_init.sh
Web Interface Configuration
# Configure Apache for op5
sudo cp /opt/monitor/etc/httpd.conf /etc/httpd/conf.d/op5.conf

# Create admin user
sudo /opt/monitor/bin/op5_user_manager.py --create --username admin --password admin123 --role administrator

# Restart services
sudo systemctl restart httpd op5-monitor
Web Interface Overview
Once configured, access the op5 web interface by navigating to http://your-server-ip/monitor in your web browser. The interface is divided into several main sections:
Main Dashboard Components
- Status Overview: Real-time status of all monitored hosts and services
- Tactical Overview: Summary statistics and health indicators
- Problems: Current alerts and issues requiring attention
- Configuration: Tools for managing monitoring configuration
- Reports: Historical data and trend analysis
Basic Monitoring Setup
Adding Host Monitoring
To start monitoring hosts, you’ll need to define host objects and their associated services:
# Navigate to Configuration > Hosts in the web interface
# Or edit configuration files directly

# Example host definition in /opt/monitor/etc/hosts.cfg
define host {
    host_name               webserver01
    alias                   Web Server 01
    address                 192.168.1.100
    use                     linux-server
    contact_groups          admins
    notification_interval   60
    notification_period     24x7
}
Service Monitoring Configuration
Define services to monitor on your hosts:
# Example service definitions in /opt/monitor/etc/services.cfg
define service {
    host_name               webserver01
    service_description     HTTP
    check_command           check_http
    use                     generic-service
    contact_groups          admins
}

define service {
    host_name               webserver01
    service_description     SSH
    check_command           check_ssh
    use                     generic-service
    contact_groups          admins
}

define service {
    host_name               webserver01
    service_description     Disk Space
    check_command           check_nrpe!check_disk
    use                     generic-service
    contact_groups          admins
}
Verifying Configuration
Always verify your configuration before applying changes:
# Check configuration syntax
sudo /opt/monitor/bin/nagios -v /opt/monitor/etc/nagios.cfg

# If configuration is valid, reload monitoring engine
sudo systemctl reload op5-monitor

# Check status
sudo systemctl status op5-monitor
Advanced Monitoring Features
Network Discovery
op5 Linux includes network discovery capabilities to automatically detect and add network devices:
# Configure network discovery
# Access Configuration > Network Discovery in web interface

# Example discovery configuration
define networkdiscovery {
    discovery_name          LAN_Discovery
    address_range           192.168.1.0/24
    exclude_range           192.168.1.1-192.168.1.10
    scan_frequency          daily
    auto_add_hosts          1
    host_template           auto-discovered-host
}
SNMP Monitoring
Configure SNMP monitoring for network devices:
# Define SNMP community and commands
define command {
    command_name    check_snmp_interface
    command_line    $USER1$/check_snmp -H $HOSTADDRESS$ -C $ARG1$ -o $ARG2$ -w $ARG3$ -c $ARG4$
}

# Monitor network interface
define service {
    host_name               switch01
    service_description     Interface eth0
    check_command           check_snmp_interface!public!1.3.6.1.2.1.2.2.1.10.1!80000000!90000000
    use                     generic-service
}
Performance Data and Graphing
Enable performance data collection for trending and capacity planning:
# Enable performance data processing in nagios.cfg
process_performance_data=1
service_perfdata_command=process-service-perfdata
host_perfdata_command=process-host-perfdata

# Configure RRD database storage
define command {
    command_name    process-service-perfdata
    command_line    /opt/monitor/libexec/process_perfdata.pl --input-file=$SERVICEPERFDATA$
}
Alert Configuration
Notification Settings
Configure how and when notifications are sent:
# Define contact for notifications
define contact {
    contact_name                    admin
    alias                           System Administrator
    email                           [email protected]
    service_notification_period     24x7
    host_notification_period        24x7
    service_notification_options    w,u,c,r
    host_notification_options       d,u,r
    service_notification_commands   notify-service-by-email
    host_notification_commands      notify-host-by-email
}

# Define contact group
define contactgroup {
    contactgroup_name       admins
    alias                   Administrators
    members                 admin
}
Escalation Rules
Set up escalation procedures for critical alerts:
# Service escalation definition
define serviceescalation {
    host_name                       webserver01
    service_description             HTTP
    first_notification              3
    last_notification               0
    notification_interval           60
    contact_groups                  managers
    escalation_options              w,c,u
}
Reporting and Analytics
op5 Linux provides comprehensive reporting capabilities through its integrated reporting module:
Availability Reports
# Generate availability report via command line
/opt/monitor/bin/op5_reports.py --report-type availability \
    --start-date "2023-01-01" \
    --end-date "2023-01-31" \
    --host "webserver01" \
    --output-format pdf \
    --output-file /tmp/availability_report.pdf
SLA Monitoring
Configure Service Level Agreement monitoring:
# SLA configuration example
define sla {
    sla_name                web_services_sla
    description             Web Services SLA - 99.5% uptime
    host_name               webserver01
    service_description     HTTP
    target_availability     99.5
    reporting_period        monthly
    contact_groups          management
}
Security Considerations
Implement security best practices for your op5 Linux installation:
User Authentication
# Enable LDAP authentication
# Edit /opt/monitor/etc/cgi.cfg

# Configure LDAP settings
use_authentication=1
use_ssl_authentication=0
authorized_for_system_information=ldap_admin_group
authorized_for_configuration_information=ldap_admin_group
authorized_for_system_commands=ldap_admin_group
Network Security
# Configure firewall rules
sudo firewall-cmd --permanent --add-port=80/tcp
sudo firewall-cmd --permanent --add-port=443/tcp
sudo firewall-cmd --permanent --add-service=ssh
sudo firewall-cmd --reload

# Enable HTTPS
sudo yum install mod_ssl
# Configure SSL certificate in Apache configuration
Maintenance and Troubleshooting
Log File Locations
Important log files for troubleshooting:
/opt/monitor/var/nagios.log– Main Nagios log file/opt/monitor/var/archive/– Archived log files/var/log/httpd/– Apache web server logs/var/log/mariadb/– Database server logs
Common Troubleshooting Commands
# Check service status
sudo systemctl status op5-monitor

# Verify configuration
sudo /opt/monitor/bin/nagios -v /opt/monitor/etc/nagios.cfg

# Check disk space
df -h /opt/monitor/var/

# Monitor log files in real-time
tail -f /opt/monitor/var/nagios.log

# Database connection test
mysql -u op5 -p op5_monitor -e "SELECT VERSION();"
Performance Optimization
Optimize op5 Linux performance for large environments:
# Optimize Nagios configuration
# In nagios.cfg
use_large_installation_tweaks=1
enable_environment_macros=0
check_external_commands=1
command_check_interval=1s

# Database optimization
# In /etc/my.cnf.d/op5.cnf
[mysqld]
innodb_buffer_pool_size=2G
innodb_log_file_size=256M
query_cache_size=128M
max_connections=500
Integration and Automation
API Usage
Leverage the op5 REST API for automation and integration:
# Example API calls using curl

# Get host status
curl -u admin:password \
    "http://your-server/api/status/host/webserver01"

# Acknowledge service problem
curl -X POST -u admin:password \
    -H "Content-Type: application/json" \
    -d '{"comment":"Working on issue","sticky":true}' \
    "http://your-server/api/command/acknowledge_svc_problem" \
    -d "host_name=webserver01&service_description=HTTP"

# Schedule downtime
curl -X POST -u admin:password \
    -H "Content-Type: application/json" \
    -d '{"comment":"Maintenance window","start_time":"2023-12-01 02:00","end_time":"2023-12-01 04:00"}' \
    "http://your-server/api/command/schedule_host_downtime" \
    -d "host_name=webserver01"
Best Practices
Follow these best practices for optimal op5 Linux deployment:
Configuration Management
- Use version control (Git) for configuration files
- Implement configuration templates for consistency
- Document all custom modifications
- Regular backup of configuration and database
Monitoring Strategy
- Start with critical systems and services
- Avoid alert fatigue by tuning thresholds appropriately
- Implement proper escalation procedures
- Regular review and optimization of monitoring rules
Capacity Planning
- Monitor system resources of the op5 server itself
- Plan for growth in the number of monitored objects
- Implement distributed monitoring for large environments
- Regular performance analysis and optimization
Conclusion
op5 Linux provides a robust, enterprise-ready network monitoring solution that combines the proven reliability of Nagios with enhanced usability and advanced features. By following this comprehensive guide, you’ll be able to successfully deploy, configure, and maintain an effective monitoring infrastructure that ensures optimal performance and minimal downtime for your IT environment.
Remember that effective monitoring is an ongoing process that requires regular maintenance, optimization, and adaptation to changing business requirements. Start with monitoring critical systems and gradually expand your monitoring coverage as you become more familiar with the platform’s capabilities.
The investment in proper monitoring infrastructure pays dividends through improved system reliability, faster problem resolution, and better capacity planning capabilities. op5 Linux provides the tools and features necessary to achieve these goals while maintaining enterprise-grade support and reliability.
Related Posts
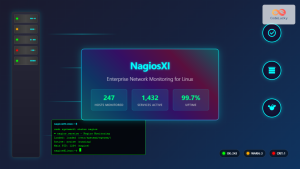
nagiosxi Linux: Complete Enterprise Network Monitoring Guide with Commands and Configuration
NagiosXI represents the pinnacle of enterprise network monitoring solutions on Linux systems, offering comprehensive infrastructure oversight with advanced alerting, reporting,...
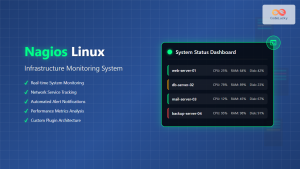
nagios Linux: Complete Infrastructure Monitoring System Setup Guide
Introduction to Nagios Nagios is one of the most popular open-source infrastructure monitoring systems available for Linux environments. Originally developed...
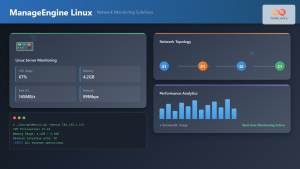
ManageEngine Linux: Complete Network Monitoring Solutions Guide
Network monitoring is crucial for maintaining optimal performance and security in Linux environments. ManageEngine provides powerful network monitoring solutions specifically...
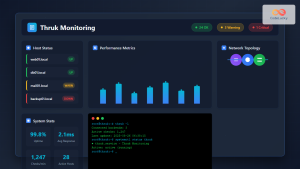
thruk Linux: Comprehensive Monitoring Web Interface for Network Infrastructure
Thruk is a powerful web-based monitoring interface designed primarily for Nagios and compatible monitoring systems. As a comprehensive frontend solution,...

whatsup Linux: Complete Network Monitoring and System Administration Guide
whatsup is a powerful network monitoring and system administration tool for Linux that provides real-time insights into network connectivity, system...
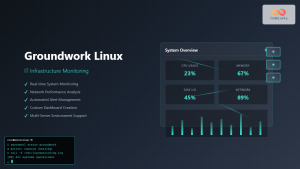
Groundwork Linux: Complete Guide to IT Infrastructure Monitoring and System Health Management
What is Groundwork Linux? Groundwork Linux is a comprehensive open-source IT infrastructure monitoring platform built specifically for Linux environments. It...
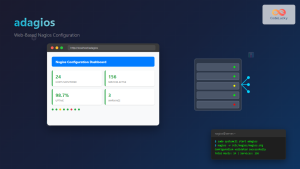
adagios Linux: Complete Guide to Web-Based Nagios Configuration Management
Managing Nagios configurations can be complex and time-consuming, especially when dealing with multiple hosts and services. adagios revolutionizes this process...
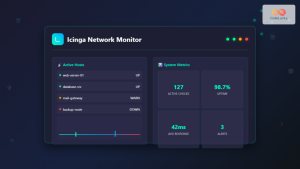
icinga Linux: Complete Network Monitoring System Guide for System Administrators
Icinga is a powerful open-source network monitoring system that helps system administrators monitor network resources, notify users of outages, and...
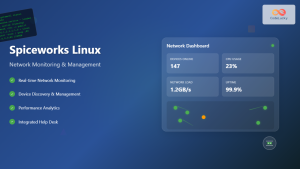
Spiceworks Linux: Complete Network Monitoring and Management Guide
Spiceworks is a powerful, free IT network monitoring and management platform that has revolutionized how system administrators handle their infrastructure....
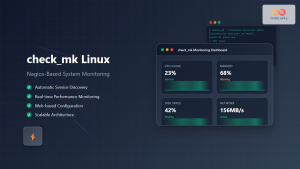
check_mk Linux: Complete Guide to Nagios-Based System Monitoring
check_mk is a powerful monitoring system built on top of Nagios that simplifies infrastructure monitoring with automated service discovery and...
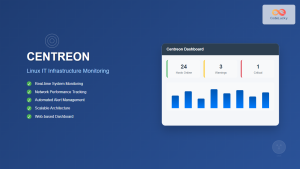
centreon Linux: Complete IT Infrastructure Monitoring Solution Guide
Centreon is a powerful, open-source IT infrastructure monitoring platform built on top of Nagios Core. It provides a comprehensive web-based...
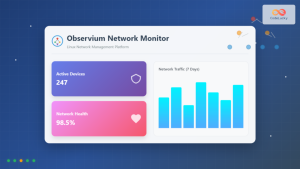
observium Linux: Complete Network Management and Monitoring Platform Guide
Observium is a powerful, auto-discovering network monitoring platform designed for Linux systems that provides comprehensive visibility into network infrastructure. This...


