The objdump command is a powerful utility in Linux systems that allows developers and system administrators to examine the contents of object files, executables, and shared libraries. As part of the GNU Binutils package, objdump provides detailed information about binary files, including assembly code, headers, symbols, and relocation data.
What is objdump?
objdump is a disassembler that displays information about object files. It can show the assembly language equivalent of machine code, examine file headers, display symbol tables, and provide insights into the structure of compiled programs. This makes it invaluable for debugging, reverse engineering, and understanding how programs are organized at the binary level.
Basic Syntax
objdump [options] [files...]The command takes various options to specify what information to display and accepts one or more file arguments to analyze.
Installation
On most Linux distributions, objdump comes pre-installed as part of the binutils package. If it’s not available, you can install it:
Ubuntu/Debian:
sudo apt update
sudo apt install binutils
CentOS/RHEL/Fedora:
sudo yum install binutils
# or for newer versions
sudo dnf install binutils
Common Options and Examples
1. Disassemble Code (-d)
The -d option disassembles executable sections of the file, showing assembly code:
objdump -d programExample Output:
program:     file format elf64-x86-64

Disassembly of section .text:

0000000000001040 <main>:
    1040:	55                   	push   %rbp
    1041:	48 89 e5             	mov    %rsp,%rbp
    1044:	48 83 ec 10          	sub    $0x10,%rsp
    1048:	c7 45 fc 00 00 00 00 	movl   $0x0,-0x4(%rbp)
    104f:	bf 00 20 00 00       	mov    $0x2000,%edi
    1054:	e8 d7 ff ff ff       	callq  1030 <puts@plt>
2. Display All Headers (-x)
Use -x to display all available header information:
objdump -x programExample Output:
program:     file format elf64-x86-64
program
architecture: i386:x86-64, flags 0x00000112:
EXEC_P, HAS_SYMS, D_PAGED
start address 0x0000000000001040

Program Header:
    PHDR off    0x0000000000000040 vaddr 0x0000000000000040 paddr 0x0000000000000040 align 2**3
         filesz 0x00000000000001f8 memsz 0x00000000000001f8 flags r-x
    INTERP off    0x0000000000000238 vaddr 0x0000000000000238 paddr 0x0000000000000238 align 2**0
3. Display File Header (-f)
The -f option shows the file header information:
objdump -f programExample Output:
program:     file format elf64-x86-64
architecture: i386:x86-64, flags 0x00000112:
EXEC_P, HAS_SYMS, D_PAGED
start address 0x0000000000001040
4. Display Symbol Table (-t)
View the symbol table with the -t option:
objdump -t programExample Output:
program:     file format elf64-x86-64

SYMBOL TABLE:
0000000000000238 l    d  .interp	0000000000000000              .interp
0000000000000254 l    d  .note.ABI-tag	0000000000000000              .note.ABI-tag
0000000000000274 l    d  .note.gnu.build-id	0000000000000000              .note.gnu.build-id
0000000000001040 g     F .text	000000000000001b              main
0000000000000000  w      *UND*	0000000000000000              puts@@GLIBC_2.2.5
5. Display Dynamic Symbol Table (-T)
For dynamic symbols in shared libraries and executables:
objdump -T programExample Output:
program:     file format elf64-x86-64

DYNAMIC SYMBOL TABLE:
0000000000000000  w   D  *UND*	0000000000000000  GLIBC_2.2.5 __gmon_start__
0000000000000000      DF *UND*	0000000000000000  GLIBC_2.2.5 puts
6. Display Section Headers (-h)
Show section header information:
objdump -h programExample Output:
program:     file format elf64-x86-64

Sections:
Idx Name          Size      VMA               LMA               File off  Algn
  0 .interp       0000001c  0000000000000238  0000000000000238  00000238  2**0
                  CONTENTS, ALLOC, LOAD, READONLY, DATA
  1 .note.ABI-tag 00000020  0000000000000254  0000000000000254  00000254  2**2
                  CONTENTS, ALLOC, LOAD, READONLY, DATA
  2 .text         000000f4  0000000000001040  0000000000001040  00001040  2**4
                  CONTENTS, ALLOC, LOAD, READONLY, CODE
7. Display Source Code Mixed with Assembly (-S)
When debug information is available, you can see source code alongside assembly:
objdump -S programNote: This requires the program to be compiled with debug information (-g flag).
Advanced Usage Examples
Analyzing Shared Libraries
Examine shared libraries to understand their exports and structure:
objdump -T /lib/x86_64-linux-gnu/libc.so.6 | head -20This displays the dynamic symbols exported by the C library.
Disassembling Specific Sections
Target specific sections for analysis:
objdump -d -j .text programThe -j option specifies which section to disassemble.
Displaying Raw Data
View raw section contents in hexadecimal:
objdump -s -j .data programExample Output:
Contents of section .data:
 2000 00000000 00000000 00000000 00000000  ................
 2010 48656c6c 6f20576f 726c6421 00        Hello World!.
Relocation Information
Display relocation entries:
objdump -r program.oExample Output:
RELOCATION RECORDS FOR [.text]:
OFFSET           TYPE              VALUE
0000000000000005 R_X86_64_32       .rodata
000000000000000a R_X86_64_PC32     puts-0x0000000000000004
Practical Use Cases
1. Debugging Segmentation Faults
When a program crashes, you can use objdump to examine the assembly code around the crash address:
objdump -d program | grep -A 10 -B 10 "1040"2. Reverse Engineering
Analyze unknown binaries to understand their functionality:
objdump -d -M intel unknown_programThe -M intel option uses Intel assembly syntax instead of AT&T syntax.
3. Library Analysis
Check what functions a library provides:
objdump -T libexample.so | grep -E "FUNC.*GLOBAL"4. Security Analysis
Examine executable sections for security features:
objdump -p program | grep STACKOutput Format Options
Intel vs AT&T Syntax
By default, objdump uses AT&T assembly syntax. Switch to Intel syntax:
objdump -d -M intel programAT&T Syntax:
mov %rsp,%rbpIntel Syntax:
mov rbp,rspAddress Display Options
Show addresses in different formats:
objdump -d --prefix-addresses programWorking with Different File Formats
objdump supports various object file formats:
- ELF (Executable and Linkable Format) – Linux standard
- PE (Portable Executable) – Windows format
- Mach-O – macOS format
- COFF (Common Object File Format)
Specify the target format if needed:
objdump -b binary -m i386 -D firmware.binPerformance Considerations
When working with large binaries:
- Use specific section options (
-j) to limit output - Redirect output to files for analysis:
objdump -d program > output.txt - Use grep to filter relevant information
Common Error Messages and Solutions
File Format Not Recognized
objdump: file.bin: file format not recognizedSolution: Specify the correct file format or ensure the file is a valid object file.
No Symbols
objdump: program: no symbolsSolution: The binary was stripped of symbols. Use -T for dynamic symbols or analyze without symbol information.
Integration with Other Tools
With GDB
Use objdump alongside GDB for comprehensive debugging:
objdump -d program > disassembly.txt
gdb program
With nm
Combine with nm for symbol analysis:
nm program | sort
objdump -t program
With readelf
Use readelf for detailed ELF information:
readelf -h program
objdump -f program
Best Practices
- Start with file headers (
-f) to understand the basic file structure - Use section headers (
-h) to identify interesting sections - Filter output with grep and other tools for specific information
- Save output to files when analyzing large binaries
- Combine multiple options for comprehensive analysis
Security Applications
objdump is valuable for security analysis:
Buffer Overflow Analysis
objdump -d program | grep -E "(call|jmp).*%"ROP Chain Detection
Search for useful gadgets in binaries:
objdump -d program | grep -E "ret$" -B 5Troubleshooting Tips
- Missing debug information: Recompile with
-gflag for source-level debugging - Stripped binaries: Focus on dynamic symbols and section analysis
- Large output: Use pagination with
lessor redirect to files - Cross-platform analysis: Use appropriate cross-compilation tools
Conclusion
The objdump command is an essential tool for anyone working with compiled code in Linux environments. Whether you’re debugging applications, analyzing malware, reverse engineering binaries, or simply trying to understand how your programs work at the assembly level, objdump provides the detailed insights you need.
By mastering its various options and understanding how to interpret its output, you’ll gain valuable skills for system-level programming, debugging, and security analysis. Remember to combine objdump with other tools like gdb, nm, and readelf for comprehensive binary analysis workflows.
Practice with different types of binaries and explore the many options available to become proficient with this powerful utility. The investment in learning objdump will pay dividends in your understanding of how software works at the lowest levels.
Related Posts
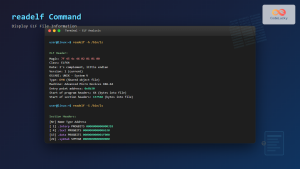
readelf Command Linux: Complete Guide to ELF File Analysis and Debugging
The readelf command is an essential tool for Linux developers, system administrators, and security analysts who need to examine Executable...
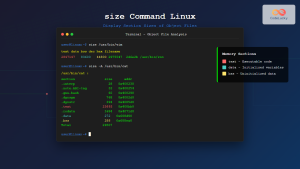
size Command Linux: Display Section Sizes of Object Files and Executables
The size command is a powerful utility in Linux systems that displays the section sizes of object files, executables, and...
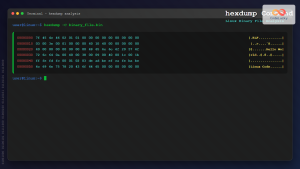
hexdump Command Linux: Complete Guide to Display File Contents in Hexadecimal Format
The hexdump command is a powerful Linux utility that displays the contents of files in hexadecimal format, making it an...
nm Command Linux: Complete Guide to Display Symbol Tables from Object Files
The nm command is a powerful utility in Linux that displays the symbol table of object files, executables, shared libraries,...
od Command Linux: Complete Guide to Octal Dump File Contents and Binary Analysis
The od (octal dump) command is a powerful Linux utility that displays file contents in various formats including octal, hexadecimal,...
file Command Advanced Linux: Master Detailed File Type Analysis and Detection
The file command is one of the most powerful and underutilized utilities in Linux for determining file types and analyzing...
strip Command Linux: Complete Guide to Removing Symbols from Object Files
The strip command is a powerful Linux utility that removes symbols, debugging information, and other metadata from executable files, object...
strings Command Linux: Extract and Analyze Text from Binary Files
The strings command is a powerful Linux utility that extracts printable character sequences from binary files. Whether you're analyzing executables,...
ranlib Command Linux: Complete Guide to Generate Archive Index Files
The ranlib command is a crucial utility in Linux systems for managing static library archives. It generates an index for...
ltrace Command Linux: Complete Guide to Trace Library Calls and Debug Programs
The ltrace command is a powerful debugging and analysis tool in Linux that allows you to trace library calls made...

C Header Files: Declaring Shared Functions and Variables
In the world of C programming, header files play a crucial role in organizing and structuring code. They serve as...
gcc Command Linux: Complete Guide to Compiling C Programs with Examples
The gcc (GNU Compiler Collection) is one of the most essential tools for C programmers working on Linux systems. This...