
Network traffic monitoring is crucial for maintaining optimal network performance, security, and troubleshooting connectivity issues. The ntopng command provides a powerful web-based solution for real-time network traffic analysis on Linux systems. This comprehensive guide explores everything you need to know about using ntopng effectively.
What is ntopng?
ntopng (network top next generation) is an advanced, web-based network traffic monitoring tool that provides real-time analysis of network flows. It’s the successor to the original ntop utility, offering enhanced features including:
- Web-based graphical interface
- Real-time traffic analysis
- Network flow monitoring
- Historical data storage
- Security threat detection
- Geolocation mapping
- REST API support
Installing ntopng on Linux
Ubuntu/Debian Installation
For Ubuntu and Debian-based systems, install ntopng using the package manager:
# Update package repository
sudo apt update

# Install ntopng
sudo apt install ntopng

# Install additional dependencies
sudo apt install redis-server
CentOS/RHEL/Fedora Installation
For Red Hat-based distributions:
# Install EPEL repository (CentOS/RHEL)
sudo yum install epel-release

# Install ntopng
sudo yum install ntopng redis

# For Fedora
sudo dnf install ntopng redis
Source Code Installation
For the latest features, compile from source:
# Install build dependencies
sudo apt install build-essential git autoconf automake libtool pkg-config

# Clone repository
git clone https://github.com/ntop/ntopng.git
cd ntopng

# Build and install
./autogen.sh
make
sudo make install
Basic ntopng Command Syntax
The basic syntax for ntopng command is:
ntopng [options] [interface]Common Command Options
| Option | Description |
|---|---|
-i <interface> |
Specify network interface to monitor |
-P <port> |
Set web interface port (default: 3000) |
-d <path> |
Specify data directory |
-r <redis> |
Redis server configuration |
-u <user> |
Run as specified user |
-l <level> |
Set logging level |
Starting ntopng: Practical Examples
Example 1: Basic Network Monitoring
Monitor traffic on the default network interface:
sudo ntopng -i eth0Expected Output:
26/Aug/2025 04:58:32 [ntopng.cpp:1856] Welcome to ntopng x86_64 v.5.6 - Please report bugs at https://github.com/ntop/ntopng/issues
26/Aug/2025 04:58:32 [ntopng.cpp:1857] Built on Linux 5.4.0 with GCC 9.4.0
26/Aug/2025 04:58:32 [ntopng.cpp:1858] Copyright 2011-2023 ntop.org
26/Aug/2025 04:58:32 [Prefs.cpp:1124] Data directory: /var/lib/ntopng/ntopng.db
26/Aug/2025 04:58:32 [HTTPserver.cpp:1456] HTTP server listening on port 3000
Example 2: Custom Port and Interface
Start ntopng on a specific interface with custom web port:
sudo ntopng -i enp0s3 -P 8080This command monitors the enp0s3 interface and makes the web interface available on port 8080.
Example 3: Multiple Interface Monitoring
Monitor multiple network interfaces simultaneously:
sudo ntopng -i eth0,wlan0 -P 3000Configuration File Setup
Create a configuration file for persistent settings:
sudo nano /etc/ntopng/ntopng.confExample configuration:
# Network interface to monitor
-i=eth0

# HTTP server port
-P=3000

# Data directory
-d=/var/lib/ntopng

# Redis configuration
-r=127.0.0.1:6379

# User to run as
-u=ntopng

# Enable geolocation
--enable-geo

# Log level
-l=3
Web Interface Features
Dashboard Overview
Once ntopng is running, access the web interface at http://localhost:3000. The dashboard provides:
- Real-time Statistics: Live traffic graphs and counters
- Top Talkers: Hosts generating most traffic
- Application Protocols: Traffic breakdown by protocol
- Geographic Distribution: Traffic mapped by location
Navigation Menu
The web interface includes several key sections:
| Section | Description |
|---|---|
| Dashboard | Overview of network statistics |
| Interfaces | Interface-specific monitoring |
| Hosts | Individual host analysis |
| Flows | Active network flows |
| Statistics | Historical data and reports |
Advanced Monitoring Features
Flow Analysis
Enable detailed flow monitoring:
sudo ntopng -i eth0 -F "tcp" --enable-flowsThis command focuses on TCP flows and provides detailed connection analysis.
Security Monitoring
Enable security features for threat detection:
sudo ntopng -i eth0 --enable-security --enable-malware-detectionHistorical Data Collection
Configure ntopng to store historical data:
sudo ntopng -i eth0 -d /var/lib/ntopng --enable-timeseriesTroubleshooting Common Issues
Permission Errors
If you encounter permission errors, ensure proper user permissions:
# Create ntopng user
sudo useradd -r -s /bin/false ntopng

# Set data directory permissions
sudo chown -R ntopng:ntopng /var/lib/ntopng
Interface Not Found
List available network interfaces:
# Show all interfaces
ip link show

# Show only active interfaces
ip link show up
Redis Connection Issues
Verify Redis server status:
# Check Redis status
sudo systemctl status redis-server

# Start Redis if not running
sudo systemctl start redis-server
Performance Optimization
Memory Management
Optimize memory usage for large networks:
sudo ntopng -i eth0 --max-num-hosts 10000 --max-num-flows 50000CPU Usage Optimization
Reduce CPU usage with sampling:
sudo ntopng -i eth0 --packet-filter "not port 22" --cpu-affinity 0,1Integration and Automation
Systemd Service Configuration
Create a systemd service for automatic startup:
sudo nano /etc/systemd/system/ntopng.serviceService configuration:
[Unit]
Description=ntopng network monitoring daemon
After=network.target

[Service]
Type=simple
User=ntopng
ExecStart=/usr/bin/ntopng /etc/ntopng/ntopng.conf
Restart=always
RestartSec=5

[Install]
WantedBy=multi-user.target
Enable and start the service:
sudo systemctl enable ntopng
sudo systemctl start ntopng
API Integration
Access ntopng data programmatically using REST API:
# Get interface statistics
curl "http://localhost:3000/lua/rest/v1/get/interface/data.lua"

# Get top hosts
curl "http://localhost:3000/lua/rest/v1/get/host/top.lua"
Security Considerations
Access Control
Configure authentication for the web interface:
# Add user authentication
sudo ntopng -i eth0 --http-auth-type basic --user admin:password
Network Security
Bind ntopng to specific interfaces for security:
sudo ntopng -i eth0 --http-address 127.0.0.1 -P 3000Best Practices
Regular Maintenance
- Log Rotation: Configure log rotation to prevent disk space issues
- Database Cleanup: Regularly clean old data to maintain performance
- Updates: Keep ntopng updated for latest features and security patches
Monitoring Strategy
- Baseline Establishment: Create network performance baselines
- Alert Configuration: Set up alerts for unusual traffic patterns
- Regular Reviews: Schedule periodic traffic analysis reviews
Conclusion
The ntopng command provides comprehensive network traffic monitoring capabilities for Linux systems. From basic traffic analysis to advanced security monitoring, ntopng offers the tools needed for effective network management. By following the examples and best practices outlined in this guide, you can implement robust network monitoring that enhances both performance and security.
Whether you’re troubleshooting network issues, monitoring bandwidth usage, or detecting security threats, ntopng’s web-based interface and powerful features make it an essential tool for network administrators and system engineers.
Related Posts
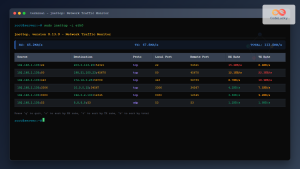
jnettop Command Linux: Monitor Real-Time Network Traffic by Connection
The jnettop command is a powerful Linux network monitoring tool that provides real-time visibility into network traffic organized by individual...
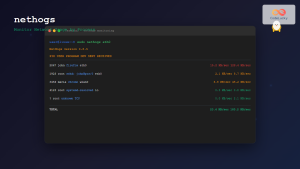
nethogs Command Linux: Monitor Real-Time Network Usage by Process
Network monitoring is a crucial aspect of system administration, especially when you need to identify which processes are consuming bandwidth...

iptraf Command Linux: Complete Interactive Network Monitoring Guide
The iptraf command is a powerful console-based network monitoring utility for Linux systems that provides real-time IP LAN monitoring capabilities....
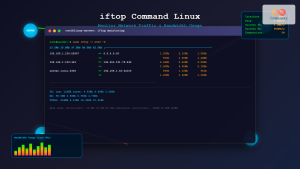
iftop Command Linux: Monitor Network Traffic and Display Bandwidth Usage by Connection
The iftop command is a powerful network monitoring tool in Linux that displays real-time bandwidth usage by network connections. Similar...
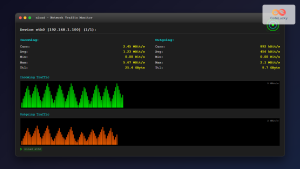
nload Command Linux: Complete Guide to Monitor Network Traffic and Bandwidth in Real-Time
The nload command is a powerful Linux utility that provides real-time monitoring of network traffic and bandwidth usage. Unlike basic...
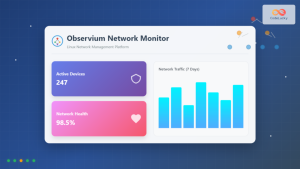
observium Linux: Complete Network Management and Monitoring Platform Guide
Observium is a powerful, auto-discovering network monitoring platform designed for Linux systems that provides comprehensive visibility into network infrastructure. This...
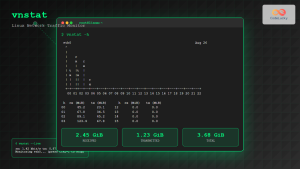
vnstat Command Linux: Complete Network Traffic Monitoring Guide
Network traffic monitoring is a crucial aspect of system administration, and the vnstat command in Linux provides an elegant solution...
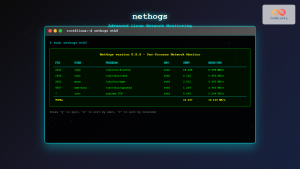
nethogs Advanced Linux: Complete Guide to Per-Process Network Monitoring
Network monitoring is crucial for system administrators and developers who need to track bandwidth usage and identify network-intensive processes. While...

Paessler Linux: Complete Guide to Network Monitoring with PRTG on Linux Systems
Network monitoring is crucial for maintaining optimal performance and security in Linux environments. Paessler PRTG Network Monitor offers comprehensive monitoring...
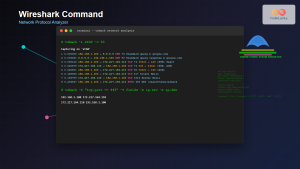
Wireshark Command Linux: Complete Network Protocol Analyzer Guide
Wireshark is the world's most popular network protocol analyzer, providing deep visibility into network traffic and communication protocols. While most...
netstat Command Linux: Complete Guide to Network Connection Monitoring
The netstat command is one of the most essential network monitoring tools in Linux systems. It provides comprehensive information about...
bmon Command Linux: Complete Guide to Real-Time Bandwidth Monitoring and Network Analysis
The bmon (Bandwidth Monitor) command is a powerful Linux utility designed for real-time network bandwidth monitoring and rate estimation. This...


