What is NSCA (Nagios Service Check Acceptor)?
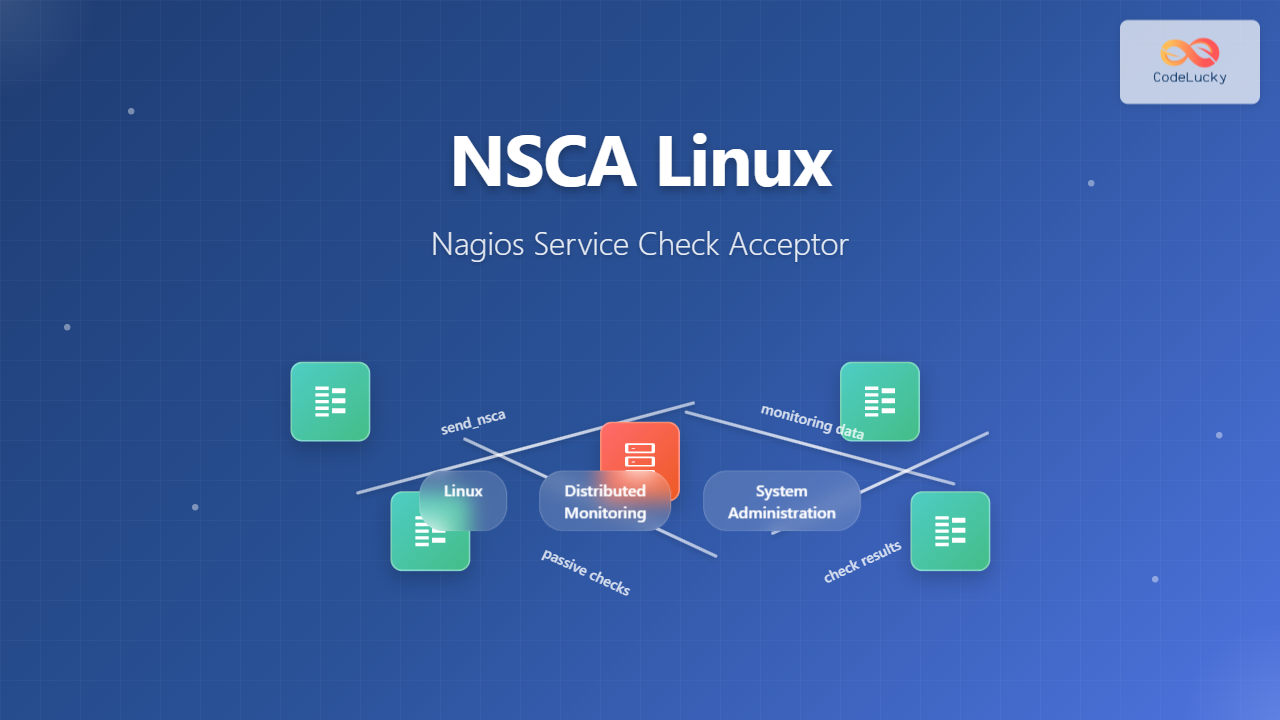
NSCA (Nagios Service Check Acceptor) is a powerful Linux daemon that allows remote hosts to send passive check results to a central Nagios monitoring server. Unlike active checks where Nagios initiates the monitoring requests, NSCA enables distributed monitoring by accepting check results from remote systems, making it essential for monitoring across firewalls, NAT devices, or in environments where direct connectivity to monitored hosts isn’t possible.
Key Features and Benefits of NSCA
- Passive Monitoring: Accepts check results from remote hosts without initiating connections
- Firewall Friendly: Only requires inbound connections to the Nagios server
- Encrypted Communication: Supports various encryption methods for secure data transmission
- Load Distribution: Reduces load on the central monitoring server
- Flexible Architecture: Supports distributed monitoring across multiple networks
NSCA Architecture Overview
NSCA consists of two main components:
- NSCA Daemon: Runs on the Nagios server to receive passive check results
- send_nsca Client: Installed on remote hosts to send check results to the NSCA daemon
The communication flow involves remote hosts executing checks locally and sending results to the central Nagios server via the NSCA protocol.
Installing NSCA on Linux Systems
Installation on Ubuntu/Debian
# Update package repositories
sudo apt update

# Install NSCA package
sudo apt install nsca nsca-client

# Verify installation
nsca --version
send_nsca --version
Installation on CentOS/RHEL/Fedora
# Install EPEL repository (if not already installed)
sudo yum install epel-release

# Install NSCA packages
sudo yum install nsca nsca-client

# For newer versions using dnf
sudo dnf install nsca nsca-client
Compiling from Source
# Download NSCA source
wget https://github.com/NagiosEnterprises/nsca/archive/nsca-2.10.2.tar.gz
tar -xzf nsca-2.10.2.tar.gz
cd nsca-nsca-2.10.2

# Configure and compile
./configure --with-nsca-user=nagios --with-nsca-group=nagios
make all

# Install binaries
sudo make install
NSCA Configuration Files
Server Configuration (nsca.cfg)
The main NSCA daemon configuration file is typically located at /etc/nsca.cfg:
# Basic NSCA daemon configuration
server_port=5667
server_address=0.0.0.0
user=nagios
group=nagios
debug=0
command_file=/var/nagios/rw/nagios.cmd
alternate_dump_file=/var/nagios/rw/nsca.dump
aggregated_writes=0
append_to_file=0
max_packet_age=30
password=MySecretPassword
decryption_method=1
pidfile=/var/run/nsca.pid
Client Configuration (send_nsca.cfg)
The send_nsca client configuration file:
# Client configuration for send_nsca
password=MySecretPassword
encryption_method=1
Encryption Methods in NSCA
NSCA supports multiple encryption methods for secure communication:
| Method ID | Encryption Type | Description |
|---|---|---|
| 0 | None | No encryption (not recommended for production) |
| 1 | Simple XOR | Basic obfuscation |
| 2 | DES | Data Encryption Standard |
| 3 | 3DES | Triple DES encryption |
| 4 | CAST-128 | CAST encryption algorithm |
| 5 | CAST-256 | Extended CAST algorithm |
| 6 | xTEA | Extended Tiny Encryption Algorithm |
| 7 | 3WAY | 3WAY block cipher |
| 8 | BLOWFISH | Blowfish encryption |
| 9 | TWOFISH | Twofish encryption |
| 10 | LOKI97 | LOKI97 cipher |
| 11 | RC2 | RC2 encryption |
| 12 | ARCFOUR | ARCFOUR stream cipher |
| 14 | RIJNDAEL-128 | AES 128-bit (recommended) |
| 15 | RIJNDAEL-192 | AES 192-bit |
| 16 | RIJNDAEL-256 | AES 256-bit (most secure) |
Starting and Managing NSCA Service
Using systemctl (SystemD)
# Start NSCA daemon
sudo systemctl start nsca

# Enable automatic startup
sudo systemctl enable nsca

# Check service status
sudo systemctl status nsca

# Restart service
sudo systemctl restart nsca

# Stop service
sudo systemctl stop nsca
Using service command
# Start NSCA service
sudo service nsca start

# Check service status
sudo service nsca status

# Restart service
sudo service nsca restart
Configuring Nagios for NSCA
Nagios Configuration Updates
Update your Nagios main configuration file (nagios.cfg) to enable external commands:
# Enable external command processing
check_external_commands=1
command_check_interval=-1
external_command_buffer_slots=4096
Defining Passive Services
Create passive service definitions in your Nagios configuration:
define service {
    host_name               remote-server-01
    service_description     CPU Load
    check_command           check_dummy!0!"Passive check"
    active_checks_enabled   0
    passive_checks_enabled  1
    check_period            none
    max_check_attempts      1
    contact_groups          admins
    notification_interval   60
    notification_period     24x7
}
Practical NSCA Examples
Example 1: Sending Simple Service Check
# Basic syntax for send_nsca
echo "hostname|service_description|return_code|plugin_output" | \
/usr/local/nagios/bin/send_nsca -H nagios_server -c /etc/send_nsca.cfg

# Example: CPU load check
echo "web-server-01|CPU Load|0|Load average: 1.2, 1.1, 0.9" | \
/usr/local/nagios/bin/send_nsca -H 192.168.1.100 -c /etc/send_nsca.cfg
Example 2: Multiple Service Checks
# Create a temporary file with multiple checks
cat > /tmp/nsca_batch.txt << EOF
web-server-01|CPU Load|0|Load average: 1.2, 1.1, 0.9
web-server-01|Memory Usage|1|Memory usage: 85% (WARNING)
web-server-01|Disk Space|0|Disk usage: /var 65% used
web-server-01|Apache Status|0|Apache is running with 25 processes
EOF

# Send batch results
/usr/local/nagios/bin/send_nsca -H 192.168.1.100 -c /etc/send_nsca.cfg < /tmp/nsca_batch.txt
Example 3: Automated Script for System Monitoring
#!/bin/bash
# NSCA monitoring script

NAGIOS_SERVER="192.168.1.100"
NSCA_CONFIG="/etc/send_nsca.cfg"
HOSTNAME=$(hostname)

# Function to send NSCA result
send_result() {
    local service="$1"
    local code="$2"
    local output="$3"
    echo "${HOSTNAME}|${service}|${code}|${output}" | \
    /usr/local/nagios/bin/send_nsca -H $NAGIOS_SERVER -c $NSCA_CONFIG
}

# Check CPU load
LOAD=$(uptime | awk -F'load average:' '{print $2}' | awk '{print $1}' | sed 's/,//')
if (( $(echo "$LOAD > 5.0" | bc -l) )); then
    send_result "CPU Load" 2 "CRITICAL: Load average $LOAD"
elif (( $(echo "$LOAD > 3.0" | bc -l) )); then
    send_result "CPU Load" 1 "WARNING: Load average $LOAD"
else
    send_result "CPU Load" 0 "OK: Load average $LOAD"
fi

# Check memory usage
MEM_USAGE=$(free | awk 'FNR == 2 {printf "%.0f", $3/$2*100}')
if [ $MEM_USAGE -gt 90 ]; then
    send_result "Memory Usage" 2 "CRITICAL: Memory usage ${MEM_USAGE}%"
elif [ $MEM_USAGE -gt 80 ]; then
    send_result "Memory Usage" 1 "WARNING: Memory usage ${MEM_USAGE}%"
else
    send_result "Memory Usage" 0 "OK: Memory usage ${MEM_USAGE}%"
fi
Troubleshooting NSCA Issues
Common Problems and Solutions
Connection Refused Errors
# Check if NSCA daemon is running
sudo netstat -tlnp | grep 5667
sudo ss -tlnp | grep 5667

# Verify firewall settings
sudo iptables -L | grep 5667
sudo firewall-cmd --list-ports

# Check NSCA daemon logs
sudo tail -f /var/log/messages | grep nsca
journalctl -u nsca -f
Permission Issues
# Check command file permissions
ls -la /var/nagios/rw/nagios.cmd

# Verify user/group settings
id nagios

# Fix permissions if needed
sudo chown nagios:nagios /var/nagios/rw/nagios.cmd
sudo chmod 664 /var/nagios/rw/nagios.cmd
Encryption/Decryption Errors
# Verify matching encryption methods and passwords
grep encryption /etc/send_nsca.cfg
grep decryption /etc/nsca.cfg

# Test with no encryption first
echo "test-host|test-service|0|Test message" | \
send_nsca -H localhost -c /dev/null
Security Best Practices
Network Security
- Firewall Configuration: Restrict NSCA port access to authorized hosts only
- Strong Passwords: Use complex passwords for NSCA communication
- Encryption: Always use strong encryption methods (AES-256) in production
- Network Segmentation: Isolate monitoring traffic when possible
Firewall Configuration Example
# iptables rule to allow NSCA only from specific networks
sudo iptables -A INPUT -p tcp --dport 5667 -s 192.168.1.0/24 -j ACCEPT
sudo iptables -A INPUT -p tcp --dport 5667 -j DROP

# firewalld configuration
sudo firewall-cmd --permanent --add-rich-rule="rule family='ipv4' source address='192.168.1.0/24' port protocol='tcp' port='5667' accept"
sudo firewall-cmd --reload
Advanced NSCA Configurations
High Availability Setup
Configure multiple NSCA servers for redundancy:
#!/bin/bash
# Script to send to multiple NSCA servers

SERVERS=("nagios1.example.com" "nagios2.example.com")
MESSAGE="$1"

for server in "${SERVERS[@]}"; do
    echo "$MESSAGE" | send_nsca -H "$server" -c /etc/send_nsca.cfg
    if [ $? -eq 0 ]; then
        echo "Successfully sent to $server"
        break
    else
        echo "Failed to send to $server, trying next..."
    fi
done
Performance Tuning
Optimize NSCA for high-volume environments:
# nsca.cfg performance settings
aggregated_writes=1
max_packet_age=30
command_file=/dev/shm/nagios.cmd  # Use tmpfs for faster writes
append_to_file=1
max_check_queue=1000000
Monitoring NSCA Performance
NSCA Statistics Script
#!/bin/bash
# Monitor NSCA performance

echo "=== NSCA Process Status ==="
ps aux | grep nsca | grep -v grep

echo -e "\n=== Network Connections ==="
netstat -an | grep 5667

echo -e "\n=== Command File Status ==="
ls -la /var/nagios/rw/nagios.cmd

echo -e "\n=== Recent Log Entries ==="
tail -20 /var/log/messages | grep nsca
Integration with Other Tools
NSCA with Cron Jobs
# Crontab entry for regular system checks
*/5 * * * * /usr/local/scripts/nsca_system_check.sh >/dev/null 2>&1

# Daily disk space check
0 2 * * * /usr/local/scripts/nsca_disk_check.sh >/dev/null 2>&1
NSCA with Custom Applications
#!/usr/bin/python3
# Python script to send NSCA results

import subprocess
import sys

def send_nsca_result(hostname, service, code, message):
    nsca_input = f"{hostname}|{service}|{code}|{message}"

    cmd = [
        "/usr/local/nagios/bin/send_nsca",
        "-H", "192.168.1.100",
        "-c", "/etc/send_nsca.cfg"
    ]

    process = subprocess.Popen(cmd, stdin=subprocess.PIPE,
                              stdout=subprocess.PIPE,
                              stderr=subprocess.PIPE, text=True)

    stdout, stderr = process.communicate(input=nsca_input)

    return process.returncode == 0

# Usage example
if __name__ == "__main__":
    success = send_nsca_result("web-server-01", "Custom Check", 0, "Application is healthy")
    if success:
        print("NSCA result sent successfully")
    else:
        print("Failed to send NSCA result")
        sys.exit(1)
Conclusion
NSCA (Nagios Service Check Acceptor) is an essential tool for implementing distributed monitoring architectures in Linux environments. By enabling passive check submissions from remote hosts, NSCA provides flexibility in monitoring systems across complex network topologies while maintaining security through encryption and access controls.
Key takeaways for successful NSCA implementation include proper security configuration with strong encryption, careful firewall management, regular monitoring of the NSCA daemon performance, and thorough testing of check result transmission. Whether you’re monitoring a small network or a large enterprise infrastructure, NSCA provides the scalability and reliability needed for comprehensive system monitoring.
Remember to regularly update your NSCA installation, monitor its performance, and follow security best practices to ensure your monitoring infrastructure remains robust and secure.

