
The nload command is a powerful Linux utility that provides real-time monitoring of network traffic and bandwidth usage. Unlike basic network monitoring tools, nload offers an intuitive visual representation of your network activity, making it an essential tool for system administrators, network engineers, and developers who need to track network performance.
What is nload Command?
nload (Network Load) is a command-line network traffic monitor that displays incoming and outgoing traffic separately using two graphs. It shows the current bandwidth usage and provides statistical information about network interfaces in real-time. The tool is particularly useful for identifying network bottlenecks, monitoring data transfer rates, and troubleshooting network-related issues.
Installing nload on Linux
Before using nload, you need to install it on your Linux system. The installation process varies depending on your distribution:
Ubuntu/Debian Systems
sudo apt update
sudo apt install nload
CentOS/RHEL/Fedora Systems
# For CentOS/RHEL with yum
sudo yum install nload

# For Fedora with dnf
sudo dnf install nload

# For CentOS/RHEL 8+ with dnf
sudo dnf install nload
Arch Linux
sudo pacman -S nloadBasic nload Syntax
The basic syntax for the nload command is straightforward:
nload [options] [interface]When run without any parameters, nload monitors the first network interface it finds (usually eth0 or the primary network interface).
Basic Usage Examples
Monitor Default Network Interface
Simply run nload without any parameters:
nloadExpected Output:
Device eth0 [192.168.1.100] (1/1):
=====================================
Incoming:
                     Curr: 1.25 MBit/s
                     Avg:  892.34 kBit/s
                     Min:  0.00 Bit/s
                     Max:  2.45 MBit/s
                     Ttl:  15.67 GByte

Outgoing:
                     Curr: 245.67 kBit/s
                     Avg:  156.78 kBit/s
                     Min:  0.00 Bit/s
                     Max:  1.12 MBit/s
                     Ttl:  3.24 GByte

####     |                    |                    |
####     |                    |                    |
######   |                    |                    |
########  |     ###           |       #            |
##########|   ######         |      ###           |
##########|  #######         |      ####          |
##########| ########         |     #####          |
##########|#########         |    ######          |
Monitor Specific Network Interface
To monitor a specific network interface:
nload eth0Or for wireless interface:
nload wlan0Advanced nload Options
Monitor Multiple Interfaces
You can monitor multiple network interfaces and switch between them using arrow keys:
nload eth0 wlan0 loUse the left and right arrow keys to switch between interfaces during monitoring.
Set Refresh Interval
Control how frequently nload updates the display (in milliseconds):
nload -t 500This sets the refresh interval to 500 milliseconds (0.5 seconds).
Change Units
Display traffic in different units:
# Display in bits per second
nload -u b

# Display in bytes per second
nload -u B

# Display in kilobits per second
nload -u k

# Display in kilobytes per second
nload -u K

# Display in megabits per second
nload -u m

# Display in megabytes per second
nload -u M
Adjust Scale
Set automatic or manual scaling for the graphs:
# Automatic scaling (default)
nload -a 300

# Manual scaling - set maximum to 1 Mbps
nload -i 1000000 -o 1000000
Understanding nload Output
The nload output consists of several key components:
Statistics Section
- Curr: Current transfer rate
- Avg: Average transfer rate since monitoring started
- Min: Minimum transfer rate observed
- Max: Maximum transfer rate observed
- Ttl: Total data transferred since monitoring started
Graph Section
The ASCII graphs show:
- Top graph: Incoming traffic
- Bottom graph: Outgoing traffic
- Height represents traffic intensity
- Time flows from right to left
Practical Use Cases
Monitoring Server Network Load
For system administrators monitoring server performance:
# Monitor with 1-second updates and megabyte units
nload -t 1000 -u M
Troubleshooting Network Issues
When diagnosing network problems:
# Monitor all interfaces with detailed view
nload -a 100 eth0 wlan0 lo
Bandwidth Testing
During file transfers or bandwidth testing:
# High refresh rate for detailed monitoring
nload -t 200 -u m
Interactive Controls
While nload is running, you can use these keyboard shortcuts:
| Key | Action |
|---|---|
| ←/→ | Switch between network interfaces |
| ↑/↓ | Adjust the scale of the graphs |
| PageUp/PageDown | Adjust refresh interval |
| s | Change traffic units |
| q | Quit nload |
| h | Show help |
Configuration File
nload can use a configuration file located at ~/.nload or /etc/nload.conf:
# Example configuration
Unit=M
RefreshInterval=500
MaxScale=10000000
AutoScale=1
Comparing with Other Network Monitoring Tools
| Tool | Real-time | Visual Graph | Multiple Interfaces | Resource Usage |
|---|---|---|---|---|
| nload | Yes | ASCII graphs | Yes | Low |
| iftop | Yes | List format | Single | Medium |
| nethogs | Yes | Process-based | All | Medium |
| bmon | Yes | Multiple formats | Yes | Low |
Common Issues and Solutions
Permission Denied Error
If you encounter permission issues:
sudo nloadInterface Not Found
List available interfaces first:
ip link show
# or
ifconfig -a
No Network Activity Shown
Ensure the interface is active and has traffic. Generate test traffic:
ping google.comBest Practices
- Use appropriate refresh intervals: Lower intervals (200-500ms) for detailed monitoring, higher intervals (2-5s) for long-term observation
- Choose suitable units: Use bits for network capacity planning, bytes for data transfer monitoring
- Monitor multiple interfaces: Include all relevant interfaces when troubleshooting
- Document baseline performance: Record normal traffic patterns for comparison
- Combine with other tools: Use alongside system monitoring tools for comprehensive analysis
Advanced Monitoring Scenarios
Server Load Monitoring
# Monitor web server with optimized settings
nload -t 1000 -u M -a 300 eth0
Development Environment
# Monitor local development traffic
nload -t 500 -u K lo eth0
Remote Server Monitoring
# SSH into remote server and monitor
ssh user@server "nload -t 2000 -u m"
Conclusion
The nload command is an invaluable tool for real-time network traffic monitoring in Linux environments. Its intuitive visual representation, combined with detailed statistics and flexible configuration options, makes it perfect for system administrators, developers, and network engineers. Whether you’re troubleshooting network issues, monitoring server performance, or simply keeping an eye on bandwidth usage, nload provides the insights you need in an easy-to-understand format.
By mastering nload’s various options and understanding its output, you can effectively monitor network performance, identify bottlenecks, and make informed decisions about network optimization. The tool’s lightweight nature and comprehensive feature set make it a must-have utility in any Linux administrator’s toolkit.
Related Posts
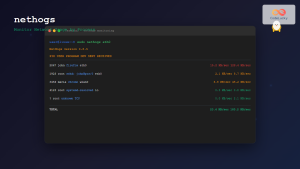
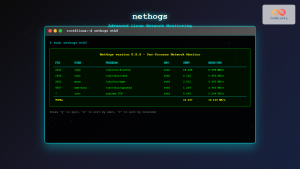
nethogs Command Linux: Monitor Real-Time Network Usage by Process
Network monitoring is a crucial aspect of system administration, especially when you need to identify which processes are consuming bandwidth...
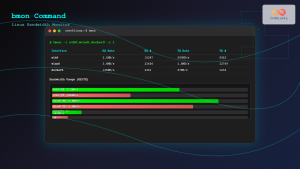
bmon Command Linux: Complete Guide to Real-Time Bandwidth Monitoring and Network Analysis
The bmon (Bandwidth Monitor) command is a powerful Linux utility designed for real-time network bandwidth monitoring and rate estimation. This...
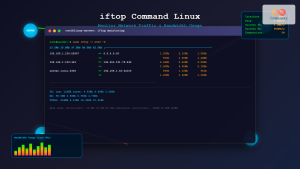
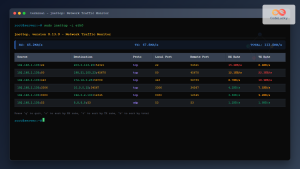
iftop Command Linux: Monitor Network Traffic and Display Bandwidth Usage by Connection
The iftop command is a powerful network monitoring tool in Linux that displays real-time bandwidth usage by network connections. Similar...
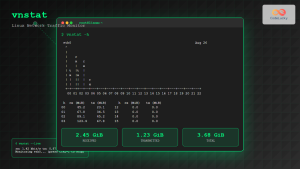
vnstat Command Linux: Complete Network Traffic Monitoring Guide
Network traffic monitoring is a crucial aspect of system administration, and the vnstat command in Linux provides an elegant solution...

iptraf Command Linux: Complete Interactive Network Monitoring Guide
The iptraf command is a powerful console-based network monitoring utility for Linux systems that provides real-time IP LAN monitoring capabilities....
nethogs Advanced Linux: Complete Guide to Per-Process Network Monitoring
Network monitoring is crucial for system administrators and developers who need to track bandwidth usage and identify network-intensive processes. While...

cbm Command Linux: Monitor Network Bandwidth in Real-Time with Color Display
The cbm (Color Bandwidth Meter) command is a powerful Linux utility that provides real-time monitoring of network bandwidth usage with...
jnettop Command Linux: Monitor Real-Time Network Traffic by Connection
The jnettop command is a powerful Linux network monitoring tool that provides real-time visibility into network traffic organized by individual...
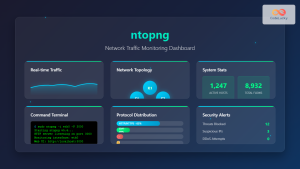
ntopng Command Linux: Complete Guide to Web-Based Network Traffic Monitoring
Network traffic monitoring is crucial for maintaining optimal network performance, security, and troubleshooting connectivity issues. The ntopng command provides a...
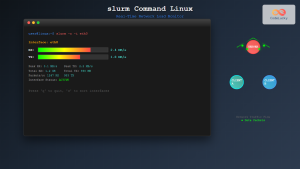
slurm Command Linux: Real-Time Network Traffic Monitor and Bandwidth Analyzer
The slurm command is a powerful network monitoring tool for Linux systems that provides real-time visualization of network traffic and...
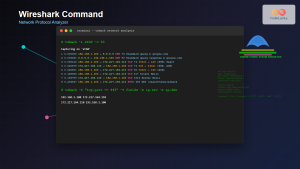
Wireshark Command Linux: Complete Network Protocol Analyzer Guide
Wireshark is the world's most popular network protocol analyzer, providing deep visibility into network traffic and communication protocols. While most...
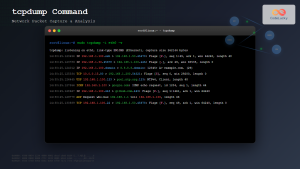
tcpdump Command Linux: Complete Guide to Network Packet Capture and Analysis
The tcpdump command is one of the most powerful network analysis tools available in Linux systems. It allows system administrators...
- What is nload Command?
- Installing nload on Linux
- Basic nload Syntax
- Basic Usage Examples
- Advanced nload Options
- Understanding nload Output
- Practical Use Cases
- Interactive Controls
- Configuration File
- Comparing with Other Network Monitoring Tools
- Common Issues and Solutions
- Best Practices
- Advanced Monitoring Scenarios
- Conclusion


