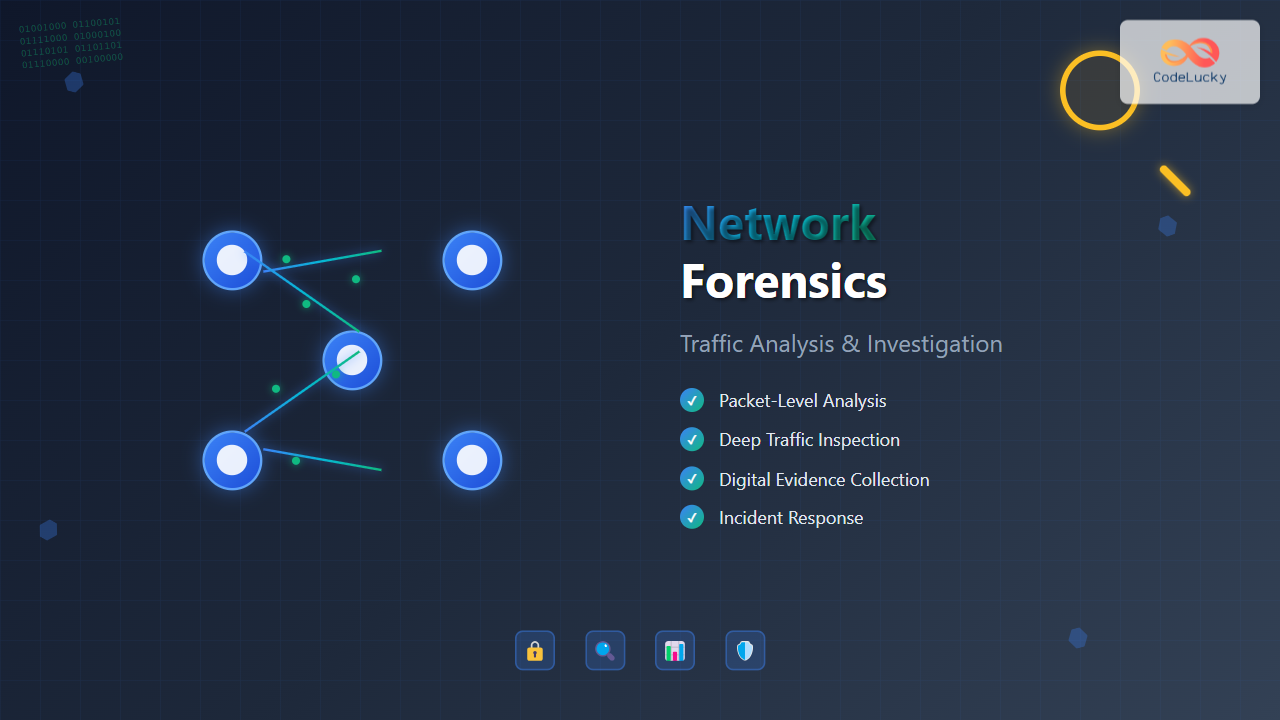
Network forensics is a specialized branch of digital forensics that focuses on monitoring, capturing, storing, and analyzing network traffic to gather information, legal evidence, or intrusion detection. As cyber threats continue to evolve, organizations need robust network forensics capabilities to investigate security incidents, maintain compliance, and protect their digital assets.
Understanding Network Forensics Fundamentals
Network forensics involves the systematic examination of network traffic data to reconstruct events, identify security breaches, and gather evidence for legal proceedings. Unlike traditional digital forensics that examines static data on storage devices, network forensics deals with volatile, real-time data flowing across network infrastructure.
Key Objectives of Network Forensics
- Incident Response: Rapidly identify and contain security breaches
- Evidence Collection: Gather admissible evidence for legal proceedings
- Network Monitoring: Continuous surveillance for suspicious activities
- Compliance Verification: Ensure adherence to regulatory requirements
- Performance Analysis: Optimize network performance and identify bottlenecks
Network Traffic Analysis Techniques
Packet-Level Analysis
Packet analysis forms the foundation of network forensics, involving the examination of individual network packets to understand communication patterns, protocols used, and data transmitted.
# Example: Basic packet capture with tcpdump
tcpdump -i eth0 -w capture.pcap -s 65535

# Filter specific traffic
tcpdump -i eth0 host 192.168.1.100 and port 80

# Analyze HTTP traffic
tcpdump -i eth0 -A -s 1500 port 80
Common Packet Analysis Parameters
| Parameter | Description | Forensic Value |
|---|---|---|
| Source IP | Origin of the packet | Identify attackers or compromised systems |
| Destination IP | Target of the communication | Determine attack targets or data exfiltration destinations |
| Port Numbers | Application services involved | Identify protocols and services being exploited |
| Timestamp | When the packet was transmitted | Create timeline of events |
| Payload | Actual data being transmitted | Extract malicious code or sensitive information |
Flow-Based Analysis
Flow analysis examines aggregated traffic patterns rather than individual packets, providing a higher-level view of network communications and making it easier to identify anomalies and trends.
# Example: Python script for flow analysis using pyshark
import pyshark

def analyze_flows(pcap_file):
    cap = pyshark.FileCapture(pcap_file)
    flows = {}

    for packet in cap:
        if hasattr(packet, 'ip'):
            flow_key = f"{packet.ip.src}-{packet.ip.dst}"

            if flow_key not in flows:
                flows[flow_key] = {
                    'packet_count': 0,
                    'total_bytes': 0,
                    'start_time': packet.sniff_time,
                    'protocols': set()
                }

            flows[flow_key]['packet_count'] += 1
            flows[flow_key]['total_bytes'] += int(packet.length)
            flows[flow_key]['protocols'].add(packet.highest_layer)

    return flows

# Usage
flows = analyze_flows('network_capture.pcap')
for flow, stats in flows.items():
    print(f"Flow: {flow}")
    print(f"Packets: {stats['packet_count']}, Bytes: {stats['total_bytes']}")
    print(f"Protocols: {', '.join(stats['protocols'])}\n")
Statistical Analysis
Statistical methods help identify patterns, anomalies, and deviations from normal network behavior that may indicate security incidents or performance issues.
Network Investigation Methodologies
Evidence Acquisition Process
Proper evidence acquisition is crucial for maintaining the integrity and admissibility of network forensic evidence in legal proceedings.
- Identification: Locate and identify potential sources of network evidence
- Preservation: Ensure data integrity through proper handling and storage
- Collection: Systematically gather network traffic data
- Examination: Analyze collected data for relevant information
- Analysis: Interpret findings and draw conclusions
- Presentation: Document and present findings clearly
Chain of Custody Management
{
  "evidence_id": "NF-2024-001",
  "case_number": "SEC-2024-0892",
  "description": "Network traffic capture from incident on 2024-08-29",
  "collection_details": {
    "timestamp": "2024-08-29T12:04:00Z",
    "collector": "John Smith",
    "method": "Live packet capture via tcpdump",
    "location": "Server Room A, Building 1"
  },
  "hash_values": {
    "md5": "a1b2c3d4e5f6789...",
    "sha256": "9f8e7d6c5b4a321..."
  },
  "custody_log": [
    {
      "timestamp": "2024-08-29T12:04:00Z",
      "action": "Collected",
      "person": "John Smith",
      "signature": "digital_signature_here"
    }
  ]
}
Timeline Reconstruction
Creating accurate timelines of network events is essential for understanding the sequence of actions during security incidents and identifying the attack vector.
Essential Network Forensics Tools
Open Source Solutions
Wireshark
The most popular network protocol analyzer, providing detailed packet inspection capabilities with an intuitive graphical interface.
# Command-line equivalent: tshark
tshark -r capture.pcap -T fields -e ip.src -e ip.dst -e tcp.port

# Filter malicious traffic
tshark -r capture.pcap -Y "http.request.method == POST and ip.dst == 192.168.1.100"

# Extract files from HTTP traffic
tshark -r capture.pcap --export-objects http,extracted_files/
Zeek (formerly Bro)
A powerful network analysis framework that generates detailed logs of network activity and can detect various types of suspicious behavior.
# Example Zeek script for detecting suspicious DNS queries
# suspicious_dns.zeek

event dns_request(c: connection, msg: dns_msg, query: string, qtype: count, qclass: count) {
    # Detect DNS queries to suspicious domains
    if (/malware\.com/ in query || /phishing\.net/ in query) {
        print fmt("Suspicious DNS query: %s from %s", query, c$id$orig_h);

        # Log to file for further investigation
        local log_file = open("suspicious_dns.log");
        print log_file, fmt("%s,%s,%s", network_time(), c$id$orig_h, query);
        close(log_file);
    }
}
Commercial Solutions
| Tool | Vendor | Key Features | Use Cases |
|---|---|---|---|
| Splunk Enterprise Security | Splunk | SIEM integration, ML-based detection | Large-scale network monitoring |
| FireEye Network Security | Mandiant | Advanced threat detection, sandboxing | APT detection and response |
| IBM QRadar | IBM | Flow analysis, behavioral analytics | Compliance and incident response |
| Riverbed SteelCentral | Riverbed | Network performance monitoring | Performance forensics |
Advanced Investigation Techniques
Deep Packet Inspection (DPI)
DPI involves examining the data payload of network packets to identify specific applications, protocols, or content patterns that may indicate malicious activity.
# Example: Python script for basic DPI using scapy
from scapy.all import *
import re

def deep_packet_inspection(packet):
    if packet.haslayer(Raw):
        payload = packet[Raw].load.decode('utf-8', errors='ignore')

        # Search for SQL injection patterns
        sql_patterns = [
            r"union\s+select",
            r"or\s+1\s*=\s*1",
            r"drop\s+table",
            r"'; exec"
        ]

        for pattern in sql_patterns:
            if re.search(pattern, payload, re.IGNORECASE):
                print(f"Potential SQL injection detected:")
                print(f"Source: {packet[IP].src}")
                print(f"Destination: {packet[IP].dst}")
                print(f"Payload: {payload[:200]}...")
                return True
    return False

# Process captured packets
packets = rdpcap('web_traffic.pcap')
for packet in packets:
    if packet.haslayer(IP):
        deep_packet_inspection(packet)
Protocol Analysis
Understanding various network protocols and their normal behavior patterns is crucial for identifying deviations that may indicate security incidents.
HTTP/HTTPS Analysis
# Extract HTTP requests and responses
tshark -r capture.pcap -Y "http" -T fields \
  -e http.request.method \
  -e http.request.uri \
  -e http.response.code \
  -e http.user_agent

# Detect potential web attacks
tshark -r capture.pcap -Y "http.request.uri contains \"../\" or
  http.request.uri contains \"
