
The netstat command is one of the most essential network monitoring tools in Linux systems. It provides comprehensive information about network connections, routing tables, interface statistics, and listening ports. Whether you’re a system administrator troubleshooting network issues or a developer monitoring application connections, mastering netstat is crucial for effective network management.
What is netstat Command?
The netstat (network statistics) command displays network connections for TCP (both incoming and outgoing), routing tables, and various network interface and protocol statistics. It’s a powerful diagnostic tool that helps administrators understand the current state of network activity on their Linux systems.
Originally part of the net-tools package, netstat has been a staple in Unix-like systems for decades. While newer tools like ss are recommended for modern systems, netstat remains widely used and supported across different Linux distributions.
Installing netstat
On most modern Linux distributions, netstat might not be installed by default. Here’s how to install it:
Ubuntu/Debian:
sudo apt update
sudo apt install net-tools
CentOS/RHEL/Fedora:
sudo yum install net-tools
# or for newer versions
sudo dnf install net-tools
Arch Linux:
sudo pacman -S net-toolsBasic netstat Syntax
The basic syntax of the netstat command is:
netstat [options]When run without any options, netstat displays a list of open sockets, but this basic output is rarely useful. The real power comes from using specific options to filter and format the information.
Essential netstat Options
Display All Connections (-a)
The -a option displays all connections, including listening and non-listening sockets:
netstat -aSample Output:
Active Internet connections (servers and established)
Proto Recv-Q Send-Q Local Address           Foreign Address         State
tcp        0      0 localhost:domain        0.0.0.0:*               LISTEN
tcp        0      0 0.0.0.0:ssh             0.0.0.0:*               LISTEN
tcp        0      0 localhost:ipp           0.0.0.0:*               LISTEN
tcp        0      0 192.168.1.100:ssh       192.168.1.50:54321      ESTABLISHED
udp        0      0 localhost:domain        0.0.0.0:*
udp        0      0 0.0.0.0:bootpc          0.0.0.0:*
Show Only Listening Ports (-l)
To display only listening ports, use the -l option:
netstat -lSample Output:
Active Internet connections (only servers)
Proto Recv-Q Send-Q Local Address           Foreign Address         State
tcp        0      0 localhost:domain        0.0.0.0:*               LISTEN
tcp        0      0 0.0.0.0:ssh             0.0.0.0:*               LISTEN
tcp        0      0 localhost:ipp           0.0.0.0:*               LISTEN
tcp6       0      0 [::]:ssh                [::]:*                  LISTEN
Display Numerical Addresses (-n)
The -n option shows numerical addresses instead of resolving hosts and ports:
netstat -anSample Output:
Active Internet connections (servers and established)
Proto Recv-Q Send-Q Local Address           Foreign Address         State
tcp        0      0 127.0.0.1:53            0.0.0.0:*               LISTEN
tcp        0      0 0.0.0.0:22              0.0.0.0:*               LISTEN
tcp        0      0 127.0.0.1:631           0.0.0.0:*               LISTEN
tcp        0      0 192.168.1.100:22        192.168.1.50:54321      ESTABLISHED
Show Process Information (-p)
The -p option displays the process ID and name associated with each connection:
sudo netstat -anpSample Output:
Active Internet connections (servers and established)
Proto Recv-Q Send-Q Local Address           Foreign Address         State       PID/Program name
tcp        0      0 127.0.0.1:53            0.0.0.0:*               LISTEN      1234/systemd-resolved
tcp        0      0 0.0.0.0:22              0.0.0.0:*               LISTEN      5678/sshd: /usr/sbin
tcp        0      0 192.168.1.100:22        192.168.1.50:54321      ESTABLISHED 9876/sshd: user
Protocol-Specific Options
TCP Connections (-t)
To display only TCP connections:
netstat -atThis filters the output to show only TCP protocol connections, making it easier to focus on TCP-specific network activity.
UDP Connections (-u)
To display only UDP connections:
netstat -auUDP connections don’t maintain state like TCP, so you’ll see different information in the State column.
Unix Domain Sockets (-x)
To display Unix domain sockets:
netstat -axSample Output:
Active UNIX domain sockets (servers and established)
Proto RefCnt Flags       Type       State         I-Node   Path
unix  2      [ ACC ]     STREAM     LISTENING     12345    /run/systemd/private
unix  2      [ ACC ]     STREAM     LISTENING     12346    /run/user/1000/pulse/native
unix  3      [ ]         STREAM     CONNECTED     12347    /run/systemd/journal/stdout
Advanced netstat Usage
Continuous Monitoring with Intervals (-c)
To continuously monitor network connections at specified intervals:
netstat -c 5This command updates the display every 5 seconds, useful for real-time monitoring of network activity.
Display Routing Table (-r)
To view the kernel routing table:
netstat -rSample Output:
Kernel IP routing table
Destination     Gateway         Genmask         Flags   MSS Window  irtt Iface
default         192.168.1.1     0.0.0.0         UG        0 0          0 eth0
192.168.1.0     0.0.0.0         255.255.255.0   U         0 0          0 eth0
Show Interface Statistics (-i)
To display network interface statistics:
netstat -iSample Output:
Kernel Interface table
Iface      MTU    RX-OK RX-ERR RX-DRP RX-OVR    TX-OK TX-ERR TX-DRP TX-OVR Flg
eth0      1500  1234567      0      0 0       9876543      0      0      0 BMRU
lo       65536    56789      0      0 0         56789      0      0      0 LRU
Practical Examples and Use Cases
Finding Which Process is Using a Specific Port
To find which process is listening on port 80:
sudo netstat -anp | grep :80Sample Output:
tcp6 0 0 :::80 :::* LISTEN 2345/apache2Monitoring Established Connections
To see only established TCP connections:
netstat -ant | grep ESTABLISHEDSample Output:
tcp        0      0 192.168.1.100:22        192.168.1.50:54321      ESTABLISHED
tcp        0      0 192.168.1.100:80        203.0.113.45:34567      ESTABLISHED
Count Connections by State
To count connections by their state:
netstat -ant | awk '{print $6}' | sort | uniq -cSample Output:
      1 established)
      5 ESTABLISHED
      8 LISTEN
      2 TIME_WAIT
Monitor Specific Protocol Traffic
To monitor only TCP traffic with process information:
sudo netstat -antpThis combination provides a comprehensive view of TCP connections with associated processes, perfect for troubleshooting network services.
Understanding netstat Output
Column Explanations
- Proto: The protocol used (TCP, UDP, TCP6, UDP6)
- Recv-Q: Number of bytes received but not yet processed by the application
- Send-Q: Number of bytes sent but not yet acknowledged
- Local Address: IP address and port of the local end
- Foreign Address: IP address and port of the remote end
- State: Connection state (LISTEN, ESTABLISHED, TIME_WAIT, etc.)
- PID/Program name: Process ID and program name (with -p option)
Common Connection States
- LISTEN: Server is waiting for incoming connections
- ESTABLISHED: Active connection with data transfer possible
- TIME_WAIT: Connection closed but waiting to ensure remote end received acknowledgment
- CLOSE_WAIT: Remote end has closed connection, local end hasn’t
- SYN_SENT: Connection request sent, waiting for response
- SYN_RECV: Connection request received and acknowledged
Security Monitoring with netstat
Detecting Suspicious Connections
Monitor for connections to unusual ports or foreign addresses:
sudo netstat -antp | grep ESTABLISHED | grep -v ':22\|:80\|:443'This command shows established connections excluding common services (SSH, HTTP, HTTPS).
Finding Open Ports
List all listening ports with their associated processes:
sudo netstat -tulpn | grep LISTENSample Output:
tcp        0      0 0.0.0.0:22              0.0.0.0:*               LISTEN      1234/sshd
tcp        0      0 127.0.0.1:3306          0.0.0.0:*               LISTEN      5678/mysqld
tcp6       0      0 :::80                   :::*                    LISTEN      9876/apache2
Performance and Troubleshooting
Network Performance Analysis
Use netstat to identify network bottlenecks by monitoring queue sizes:
netstat -an | awk 'NR>2{if($2>0 || $3>0) print $0}'This command shows connections with non-zero receive or send queues, indicating potential performance issues.
Connection Monitoring Script
Create a simple monitoring script:
#!/bin/bash
while true; do
    echo "$(date): Active connections"
    netstat -ant | grep ESTABLISHED | wc -l
    sleep 10
done
Alternatives to netstat
While netstat is still widely used, newer tools offer enhanced functionality:
ss Command
The ss (socket statistics) command is faster and provides more information:
ss -tulnThis is the modern replacement for netstat and is recommended for new scripts and regular use.
lsof Command
For process-specific network monitoring:
lsof -iThis shows network connections opened by specific processes.
Common netstat Command Combinations
Here are the most frequently used netstat command combinations:
# Show all listening ports with process info
sudo netstat -tulpn

# Monitor established connections continuously
netstat -ant | grep ESTABLISHED | watch -n 1

# Find connections to specific port
netstat -an | grep :443

# Show network statistics
netstat -s

# Display multicast group membership
netstat -g
Best Practices
- Use numerical output (-n): Faster execution and more precise information
- Combine options effectively: Use -tulpn for comprehensive port monitoring
- Filter output: Use grep and other tools to focus on specific information
- Consider alternatives: Use ss for better performance on modern systems
- Script automation: Create monitoring scripts for regular network analysis
- Security focus: Regularly monitor for unexpected listening services
Conclusion
The netstat command remains an invaluable tool for Linux network administration and troubleshooting. Its comprehensive output and flexible options make it perfect for everything from quick connection checks to detailed network analysis. While newer tools like ss offer improved performance, netstat’s ubiquity and familiar syntax ensure it will continue to be a cornerstone of Linux network monitoring.
Mastering netstat’s various options and understanding how to interpret its output will significantly enhance your ability to manage and troubleshoot Linux network connections. Whether you’re monitoring server performance, investigating security issues, or simply understanding your system’s network activity, netstat provides the insights you need to maintain optimal network operations.
Practice with these examples and gradually incorporate more advanced usage patterns into your daily workflow. The investment in learning netstat thoroughly will pay dividends in your Linux administration and troubleshooting capabilities.
Related Posts
ss Command Linux: Complete Guide to Modern Socket Statistics and Network Analysis
The ss command is a powerful and modern utility for investigating sockets and network connections in Linux systems. As the...
jnettop Command Linux: Monitor Real-Time Network Traffic by Connection
The jnettop command is a powerful Linux network monitoring tool that provides real-time visibility into network traffic organized by individual...

iptraf Command Linux: Complete Interactive Network Monitoring Guide
The iptraf command is a powerful console-based network monitoring utility for Linux systems that provides real-time IP LAN monitoring capabilities....
nethogs Command Linux: Monitor Real-Time Network Usage by Process
Network monitoring is a crucial aspect of system administration, especially when you need to identify which processes are consuming bandwidth...
iftop Command Linux: Monitor Network Traffic and Display Bandwidth Usage by Connection
The iftop command is a powerful network monitoring tool in Linux that displays real-time bandwidth usage by network connections. Similar...
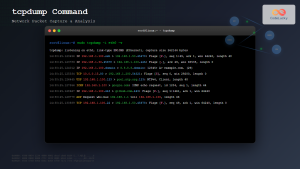
tcpdump Command Linux: Complete Guide to Network Packet Capture and Analysis
The tcpdump command is one of the most powerful network analysis tools available in Linux systems. It allows system administrators...
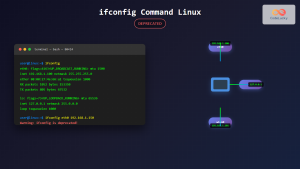
ifconfig Command Linux: Complete Guide to Network Interface Configuration (Deprecated)
The ifconfig (interface configuration) command has been a cornerstone of Linux network administration for decades. While officially deprecated in favor...
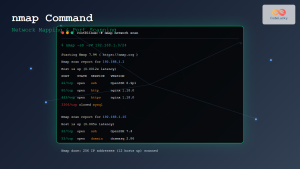
nmap Command Linux: Complete Guide to Network Mapping and Port Scanning
The nmap (Network Mapper) command is one of the most powerful and versatile network discovery and security auditing tools available...
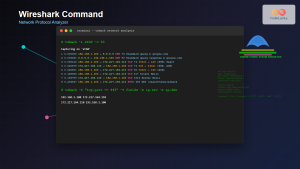
Wireshark Command Linux: Complete Network Protocol Analyzer Guide
Wireshark is the world's most popular network protocol analyzer, providing deep visibility into network traffic and communication protocols. While most...

Paessler Linux: Complete Guide to Network Monitoring with PRTG on Linux Systems
Network monitoring is crucial for maintaining optimal performance and security in Linux environments. Paessler PRTG Network Monitor offers comprehensive monitoring...
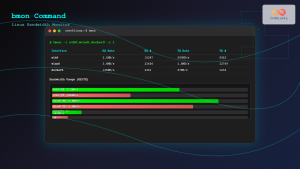
bmon Command Linux: Complete Guide to Real-Time Bandwidth Monitoring and Network Analysis
The bmon (Bandwidth Monitor) command is a powerful Linux utility designed for real-time network bandwidth monitoring and rate estimation. This...
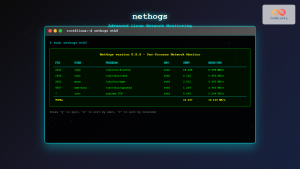
nethogs Advanced Linux: Complete Guide to Per-Process Network Monitoring
Network monitoring is crucial for system administrators and developers who need to track bandwidth usage and identify network-intensive processes. While...


