
Network monitoring is crucial for system administrators and developers who need to track bandwidth usage and identify network-intensive processes. While tools like top and htop show CPU and memory usage, they don’t provide detailed network activity per process. This is where nethogs becomes invaluable.
nethogs is a powerful Linux command-line tool that displays real-time network bandwidth usage grouped by process. Unlike traditional network monitoring tools that show total bandwidth consumption, nethogs breaks down network activity to individual processes, making it easier to identify bandwidth-hungry applications.
What is nethogs?
nethogs (Network TOP for processes) is a network monitoring utility that displays bandwidth usage per process in real-time. It groups network traffic by process ID (PID) and shows both sent and received data for each application. This granular view helps administrators quickly identify which processes are consuming network resources.
Key Features of nethogs
- Per-process monitoring: Shows network usage for individual processes
- Real-time updates: Continuously refreshes data every few seconds
- Interactive interface: Allows sorting and filtering during runtime
- Multiple network interfaces: Can monitor specific network adapters
- Lightweight: Minimal system resource consumption
- Process tree view: Shows parent-child process relationships
Installing nethogs
Before using nethogs, you need to install it on your Linux system. The installation method varies depending on your distribution.
Ubuntu/Debian Installation
sudo apt update
sudo apt install nethogs
CentOS/RHEL/Fedora Installation
# For CentOS/RHEL with yum
sudo yum install nethogs

# For Fedora with dnf
sudo dnf install nethogs

# For CentOS/RHEL 8+ with dnf
sudo dnf install nethogs
Arch Linux Installation
sudo pacman -S nethogsCompiling from Source
If nethogs isn’t available in your distribution’s repositories, you can compile it from source:
# Install dependencies (Ubuntu/Debian)
sudo apt install build-essential libncurses5-dev libpcap-dev

# Download and compile
git clone https://github.com/raboof/nethogs.git
cd nethogs
make
sudo make install
Basic nethogs Usage
Running nethogs requires root privileges since it needs to access network interfaces and process information. Here’s the basic syntax:
sudo nethogs [options] [interface]Simple nethogs Execution
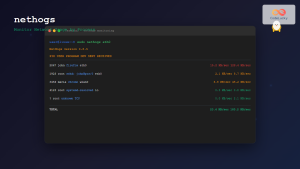
sudo nethogsThis command monitors the default network interface and displays output similar to:
NetHogs version 0.8.6

    PID USER     PROGRAM                      DEV        SENT      RECEIVED
   2341 john     /usr/bin/firefox            wlan0       1.234     5.678 KB/sec
   1892 root     /usr/sbin/sshd              wlan0       0.123     0.456 KB/sec
   3421 mary     /usr/bin/wget               wlan0       0.001     2.345 KB/sec
      ? root     unknown TCP                 wlan0       0.000     0.234 KB/sec

  TOTAL                                                  1.358     8.713 KB/sec
Understanding the Output
The nethogs output contains several columns:
- PID: Process ID of the application
- USER: Username running the process
- PROGRAM: Full path to the executable
- DEV: Network interface being used
- SENT: Data sent by the process (upstream)
- RECEIVED: Data received by the process (downstream)
Advanced nethogs Options
nethogs offers numerous command-line options for customized monitoring.
Monitoring Specific Network Interfaces
# Monitor ethernet interface
sudo nethogs eth0

# Monitor wireless interface
sudo nethogs wlan0

# Monitor multiple interfaces
sudo nethogs eth0 wlan0
Refresh Rate Control
Use the -d option to control update intervals:
# Update every 5 seconds (default is 1 second)
sudo nethogs -d 5

# Update every 0.5 seconds for real-time monitoring
sudo nethogs -d 0.5
Bandwidth Unit Selection
Control the display units with the -v option:
# Display in KB/s, MB/s, GB/s (default)
sudo nethogs -v 1

# Display in KB/s only
sudo nethogs -v 0

# Display in MB/s only
sudo nethogs -v 2
Process Filtering
Filter processes using various criteria:
# Show only processes for specific user
sudo nethogs -p firefox

# Trace mode - shows all connections
sudo nethogs -t

# Monitor only TCP traffic
sudo nethogs -s
Interactive Commands During Runtime
While nethogs is running, you can use various interactive commands to control the display:
| Key | Function |
|---|---|
| q | Quit nethogs |
| s | Sort by sent traffic |
| r | Sort by received traffic |
| m | Change between KB/s, MB/s, GB/s |
| Enter | Expand/collapse process tree |
| Tab | Switch between different views |
Practical Examples and Use Cases
Example 1: Monitoring Web Server Traffic
When managing a web server, you might want to monitor which processes are generating the most network traffic:
sudo nethogs -d 2 eth0Sample output:
NetHogs version 0.8.6

    PID USER     PROGRAM                      DEV        SENT      RECEIVED
   1234 www-data /usr/sbin/apache2           eth0       15.234    2.456 MB/sec
   5678 mysql    /usr/sbin/mysqld            eth0       0.234     0.123 MB/sec
   9012 root     /usr/sbin/sshd              eth0       0.045     0.032 MB/sec

  TOTAL                                                 15.513    2.611 MB/sec
Example 2: Identifying Bandwidth-Heavy Downloads
To identify which user processes are downloading large files:
sudo nethogs -v 2 -d 1This shows bandwidth in MB/s with 1-second updates, helping you spot heavy downloads quickly.
Example 3: Monitoring During System Updates
When running system updates, monitor which package manager processes are using bandwidth:
sudo nethogs wlan0You might see output like:
    PID USER     PROGRAM                      DEV        SENT      RECEIVED
   3456 root     /usr/bin/apt                wlan0       0.123     5.234 MB/sec
   3457 _apt     /usr/lib/apt/methods/http   wlan0       0.045     12.567 MB/sec
Advanced Monitoring Scenarios
Combining nethogs with Other Tools
For comprehensive system monitoring, combine nethogs with other utilities:
# Terminal 1: Monitor network per process
sudo nethogs

# Terminal 2: Monitor overall system resources
htop

# Terminal 3: Monitor network interface statistics
watch -n 1 cat /proc/net/dev
Logging Network Usage
While nethogs doesn’t have built-in logging, you can capture its output:
# Capture nethogs output to a file
sudo nethogs -t > network_log.txt 2>&1 &

# Monitor the log in real-time
tail -f network_log.txt
Creating Network Usage Scripts
Create a bash script to automate network monitoring:
#!/bin/bash
# network_monitor.sh

INTERFACE=${1:-eth0}
DURATION=${2:-60}
LOGFILE="/var/log/network_usage_$(date +%Y%m%d_%H%M%S).log"

echo "Monitoring $INTERFACE for $DURATION seconds..."
echo "Log file: $LOGFILE"

timeout $DURATION sudo nethogs -t $INTERFACE > $LOGFILE 2>&1

echo "Monitoring complete. Top bandwidth users:"
grep -E "^\s+[0-9]+" $LOGFILE | sort -k5 -nr | head -5
Troubleshooting Common Issues
Permission Denied Errors
If you encounter permission errors, ensure you’re running with sudo:
sudo nethogsIf still having issues, check if your user is in the appropriate groups:
sudo usermod -a -G netdev $USERInterface Not Found
List available network interfaces before running nethogs:
# List all network interfaces
ip link show

# Or use the older command
ifconfig -a

# Then specify the correct interface
sudo nethogs wlan0
High CPU Usage
If nethogs causes high CPU usage, increase the refresh interval:
# Update every 5 seconds instead of 1
sudo nethogs -d 5
Missing Process Information
Sometimes processes show as “unknown TCP”. This happens when:
- Processes terminate before nethogs can identify them
- Network connections are established by kernel modules
- Processes are running in different namespaces
To get more detailed information, try running in trace mode:
sudo nethogs -tComparison with Other Network Monitoring Tools
nethogs vs iftop
iftop shows network connections between hosts, while nethogs shows usage per process:
# iftop - shows connections between hosts
sudo iftop

# nethogs - shows usage per process
sudo nethogs
nethogs vs netstat
netstat shows network connections and statistics but not real-time bandwidth usage:
# netstat - shows connections (static)
netstat -tuln

# nethogs - shows bandwidth usage (dynamic)
sudo nethogs
nethogs vs ss
ss is a modern replacement for netstat but also doesn’t show bandwidth usage:
# ss - shows socket statistics
ss -tuln

# nethogs - shows per-process bandwidth
sudo nethogs
Best Practices for Using nethogs
Regular Monitoring Schedule
Establish regular monitoring periods to understand normal network patterns:
- Monitor during peak hours to identify bottlenecks
- Run overnight monitoring to catch automated processes
- Compare weekday vs weekend patterns
Setting Up Alerts
Create simple scripts to alert when bandwidth usage exceeds thresholds:
#!/bin/bash
# bandwidth_alert.sh

THRESHOLD=10  # MB/sec
LOGFILE="/tmp/nethogs_check.log"

# Run nethogs for 30 seconds and capture output
timeout 30 sudo nethogs -v 2 > $LOGFILE 2>&1 &
NETHOGS_PID=$!

sleep 30
kill $NETHOGS_PID 2>/dev/null

# Check for high bandwidth usage
HIGH_USAGE=$(grep -E "^\s+[0-9]+" $LOGFILE | awk '$5 > '$THRESHOLD' || $6 > '$THRESHOLD)

if [ ! -z "$HIGH_USAGE" ]; then
    echo "High bandwidth usage detected:"
    echo "$HIGH_USAGE"
    # Add notification logic here (email, SMS, etc.)
fi
Documentation and Reporting
Maintain logs of unusual network activity for security and performance analysis:
- Document processes with unexpected high bandwidth usage
- Track patterns that might indicate security issues
- Create reports for capacity planning
Security Considerations
When using nethogs in production environments, consider these security aspects:
Privilege Management
nethogs requires root privileges, so consider using sudo rules for specific users:
# Add to /etc/sudoers
username ALL=(ALL) NOPASSWD: /usr/sbin/nethogs
Log Security
Protect network monitoring logs as they may contain sensitive information:
# Set appropriate permissions on log files
chmod 640 /var/log/network_*.log
chown root:adm /var/log/network_*.log
Privacy Considerations
Be aware that nethogs shows user activity and process information. Ensure compliance with privacy policies when monitoring user traffic.
Performance Optimization
Reducing System Impact
To minimize nethogs’ impact on system performance:
- Increase refresh intervals for continuous monitoring
- Limit monitoring to specific interfaces when possible
- Use process filtering to focus on specific applications
# Optimized for continuous monitoring
sudo nethogs -d 10 eth0
Resource Usage Monitoring
Monitor nethogs’ own resource usage:
# Check nethogs CPU and memory usage
ps aux | grep nethogs
Conclusion
nethogs is an invaluable tool for Linux system administrators and developers who need detailed, per-process network monitoring. Its ability to show real-time bandwidth usage broken down by individual processes makes it superior to traditional network monitoring tools for troubleshooting bandwidth issues and identifying network-intensive applications.
Key takeaways for effective nethogs usage:
- Always run with sudo privileges for full functionality
- Use appropriate refresh intervals based on your monitoring needs
- Combine with other system monitoring tools for comprehensive analysis
- Implement logging and alerting for production environments
- Consider security and privacy implications in multi-user environments
By mastering nethogs and incorporating it into your system administration toolkit, you’ll have powerful insights into network usage patterns and be better equipped to maintain optimal network performance across your Linux systems.
Whether you’re troubleshooting performance issues, monitoring server bandwidth, or simply understanding how applications use network resources, nethogs provides the granular visibility needed for effective network management in modern Linux environments.
Related Posts
nethogs Command Linux: Monitor Real-Time Network Usage by Process
Network monitoring is a crucial aspect of system administration, especially when you need to identify which processes are consuming bandwidth...
iftop Command Linux: Monitor Network Traffic and Display Bandwidth Usage by Connection
The iftop command is a powerful network monitoring tool in Linux that displays real-time bandwidth usage by network connections. Similar...
jnettop Command Linux: Monitor Real-Time Network Traffic by Connection
The jnettop command is a powerful Linux network monitoring tool that provides real-time visibility into network traffic organized by individual...
slurm Command Linux: Real-Time Network Traffic Monitor and Bandwidth Analyzer
The slurm command is a powerful network monitoring tool for Linux systems that provides real-time visualization of network traffic and...
nload Command Linux: Complete Guide to Monitor Network Traffic and Bandwidth in Real-Time
The nload command is a powerful Linux utility that provides real-time monitoring of network traffic and bandwidth usage. Unlike basic...
vnstat Command Linux: Complete Network Traffic Monitoring Guide
Network traffic monitoring is a crucial aspect of system administration, and the vnstat command in Linux provides an elegant solution...

iptraf Command Linux: Complete Interactive Network Monitoring Guide
The iptraf command is a powerful console-based network monitoring utility for Linux systems that provides real-time IP LAN monitoring capabilities....
ntopng Command Linux: Complete Guide to Web-Based Network Traffic Monitoring
Network traffic monitoring is crucial for maintaining optimal network performance, security, and troubleshooting connectivity issues. The ntopng command provides a...
netstat Command Linux: Complete Guide to Network Connection Monitoring
The netstat command is one of the most essential network monitoring tools in Linux systems. It provides comprehensive information about...
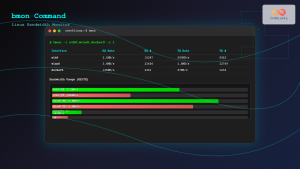
bmon Command Linux: Complete Guide to Real-Time Bandwidth Monitoring and Network Analysis
The bmon (Bandwidth Monitor) command is a powerful Linux utility designed for real-time network bandwidth monitoring and rate estimation. This...

cbm Command Linux: Monitor Network Bandwidth in Real-Time with Color Display
The cbm (Color Bandwidth Meter) command is a powerful Linux utility that provides real-time monitoring of network bandwidth usage with...
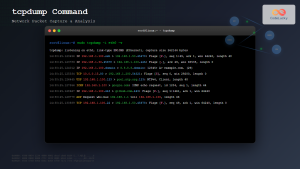
tcpdump Command Linux: Complete Guide to Network Packet Capture and Analysis
The tcpdump command is one of the most powerful network analysis tools available in Linux systems. It allows system administrators...


