
Network monitoring is a crucial aspect of system administration, especially when you need to identify which processes are consuming bandwidth on your Linux system. The nethogs command is a powerful tool that provides real-time monitoring of network usage per process, making it invaluable for network troubleshooting and performance optimization.
What is nethogs?
nethogs is a small “net top” tool that displays network usage by individual processes rather than breaking traffic down by protocol or subnet. Unlike other network monitoring tools that show total bandwidth usage, nethogs groups bandwidth usage by process, helping you quickly identify which applications are consuming your network resources.
Key Features of nethogs
- Real-time network usage monitoring per process
- Display both sent and received data for each process
- Interactive interface similar to the
topcommand - Support for multiple network interfaces
- Minimal system resource consumption
- Process grouping and filtering capabilities
Installing nethogs
Before using nethogs, you need to install it on your system. The installation method varies depending on your Linux distribution:
Ubuntu/Debian
sudo apt update
sudo apt install nethogs
CentOS/RHEL/Fedora
# For CentOS/RHEL 7 and earlier
sudo yum install nethogs

# For CentOS/RHEL 8+ and Fedora
sudo dnf install nethogs
Arch Linux
sudo pacman -S nethogsopenSUSE
sudo zypper install nethogsBasic Usage
To start monitoring network usage with nethogs, simply run the command with sudo privileges (required for network monitoring):
sudo nethogsThis will display a real-time view of network usage by process, showing:
- PID: Process ID
- USER: User running the process
- PROGRAM: Name of the program/process
- DEV: Network interface being used
- SENT: Data sent by the process (upload)
- RECEIVED: Data received by the process (download)
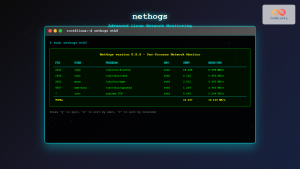
Sample Output
NetHogs version 0.8.5

    PID USER     PROGRAM                      DEV        SENT      RECEIVED
   2847 john     firefox                      eth0       1.234     15.678 KB/sec
   1923 root     sshd: john@pts/0             eth0       0.456      2.123 KB/sec
   3456 maria    chrome                       wlan0      0.789      8.901 KB/sec
      ? root     unknown TCP                             0.000      0.000 KB/sec

  TOTAL                                                  2.479     26.702 KB/sec
Command Line Options
nethogs offers several command-line options to customize its behavior:
Specify Network Interface
Monitor a specific network interface:
sudo nethogs eth0Monitor multiple interfaces:
sudo nethogs eth0 wlan0Set Refresh Delay
Change the refresh interval (default is 1 second):
sudo nethogs -d 5 # Refresh every 5 secondsFilter by Process
Monitor only processes matching a specific pattern:
sudo nethogs -p firefoxSpecify Port Range
Monitor only specific port ranges:
sudo nethogs -p 80,443,22Trace Mode
Run in trace mode to log output to a file:
sudo nethogs -t > network_usage.logInteractive Commands
While nethogs is running, you can use several interactive commands:
| Key | Action |
|---|---|
s |
Sort by sent data |
r |
Sort by received data |
m |
Cycle through display modes |
q |
Quit nethogs |
Ctrl+L |
Refresh the display |
Advanced Usage Examples
Example 1: Monitor Web Server Traffic
If you’re running a web server, you can monitor HTTP/HTTPS traffic specifically:
sudo nethogs -p 80,443This will show only processes using ports 80 and 443, helping you identify web-related network activity.
Example 2: Log Network Usage to File
For continuous monitoring and analysis, you can log nethogs output:
sudo nethogs -t -d 10 > /var/log/network-usage.log &This runs nethogs in the background, updating every 10 seconds and logging to a file.
Example 3: Monitor Specific User Activity
While nethogs doesn’t have a built-in user filter, you can combine it with other tools:
sudo nethogs | grep "username"Example 4: Monitor Docker Container Network Usage
For Docker environments, monitor the docker interface:
sudo nethogs docker0Understanding the Output
Let’s break down a typical nethogs output:
   PID USER     PROGRAM                      DEV        SENT      RECEIVED
  2847 john     firefox                      eth0       1.234     15.678 KB/sec
  1923 root     sshd: john@pts/0             eth0       0.456      2.123 KB/sec
? root unknown TCP 0.000 0.000 KB/sec- PID 2847: Firefox process consuming significant bandwidth (likely browsing or downloading)
- PID 1923: SSH connection showing moderate activity
- Unknown TCP: Network activity that couldn’t be attributed to a specific process
Troubleshooting Common Issues
Permission Denied
Always run nethogs with sudo privileges:
sudo nethogsNo Network Interface Found
List available interfaces first:
ip link show
# or
ifconfig -a
Then specify the correct interface:
sudo nethogs enp0s3 # Replace with your interface nameHigh CPU Usage
If nethogs is consuming too much CPU, increase the refresh interval:
sudo nethogs -d 10 # Update every 10 seconds instead of 1Comparing nethogs with Other Tools
| Tool | Purpose | Granularity |
|---|---|---|
nethogs |
Network usage by process | Per process |
iftop |
Network usage by connection | Per connection |
nload |
Total network usage | Per interface |
vnstat |
Network statistics | Historical data |
Best Practices
- Regular Monitoring: Use nethogs during peak usage times to identify bandwidth-hungry applications
- Baseline Establishment: Monitor normal network patterns to identify anomalies
- Combine with Other Tools: Use alongside
htopandiotopfor comprehensive system monitoring - Log Analysis: Keep logs for trend analysis and capacity planning
- Security Monitoring: Watch for unexpected network activity that might indicate security issues
Automating nethogs Monitoring
Create a simple script for automated monitoring:
#!/bin/bash
# network-monitor.sh

LOG_FILE="/var/log/nethogs-$(date +%Y%m%d).log"
INTERFACE="eth0"

echo "Starting network monitoring at $(date)" >> $LOG_FILE
sudo nethogs -t -d 60 $INTERFACE >> $LOG_FILE &

echo "Network monitoring started. PID: $!"
echo "Log file: $LOG_FILE"
Make it executable and run:
chmod +x network-monitor.sh
./network-monitor.sh
Conclusion
The nethogs command is an essential tool for Linux system administrators and users who need to monitor network usage at the process level. Its real-time monitoring capabilities, combined with its simple interface and low resource consumption, make it perfect for identifying bandwidth-consuming applications, troubleshooting network issues, and optimizing system performance.
Whether you’re managing a busy web server, debugging network performance issues, or simply curious about which applications are using your bandwidth, nethogs provides the granular visibility you need. By combining it with other monitoring tools and following best practices, you can maintain optimal network performance and quickly identify potential issues before they impact your system.
Remember to always run nethogs with appropriate privileges and consider the refresh interval based on your monitoring needs. With practice, you’ll find nethogs to be an indispensable addition to your Linux toolkit.
Related Posts
nethogs Advanced Linux: Complete Guide to Per-Process Network Monitoring
Network monitoring is crucial for system administrators and developers who need to track bandwidth usage and identify network-intensive processes. While...
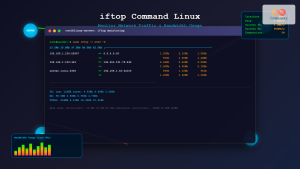
iftop Command Linux: Monitor Network Traffic and Display Bandwidth Usage by Connection
The iftop command is a powerful network monitoring tool in Linux that displays real-time bandwidth usage by network connections. Similar...
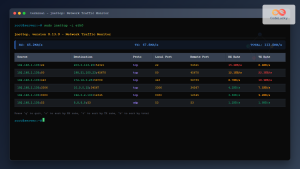
jnettop Command Linux: Monitor Real-Time Network Traffic by Connection
The jnettop command is a powerful Linux network monitoring tool that provides real-time visibility into network traffic organized by individual...
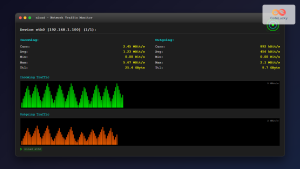
nload Command Linux: Complete Guide to Monitor Network Traffic and Bandwidth in Real-Time
The nload command is a powerful Linux utility that provides real-time monitoring of network traffic and bandwidth usage. Unlike basic...
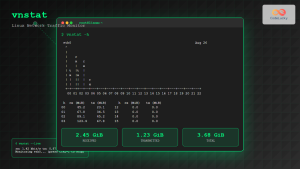
vnstat Command Linux: Complete Network Traffic Monitoring Guide
Network traffic monitoring is a crucial aspect of system administration, and the vnstat command in Linux provides an elegant solution...

iptraf Command Linux: Complete Interactive Network Monitoring Guide
The iptraf command is a powerful console-based network monitoring utility for Linux systems that provides real-time IP LAN monitoring capabilities....
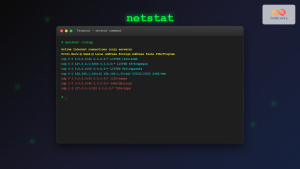
netstat Command Linux: Complete Guide to Network Connection Monitoring
The netstat command is one of the most essential network monitoring tools in Linux systems. It provides comprehensive information about...
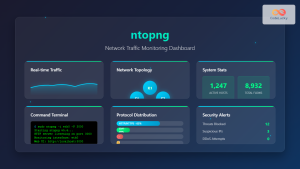
ntopng Command Linux: Complete Guide to Web-Based Network Traffic Monitoring
Network traffic monitoring is crucial for maintaining optimal network performance, security, and troubleshooting connectivity issues. The ntopng command provides a...
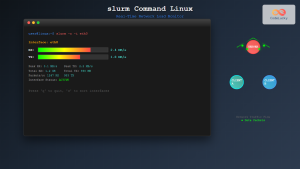
slurm Command Linux: Real-Time Network Traffic Monitor and Bandwidth Analyzer
The slurm command is a powerful network monitoring tool for Linux systems that provides real-time visualization of network traffic and...
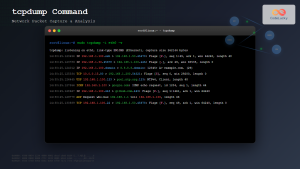
tcpdump Command Linux: Complete Guide to Network Packet Capture and Analysis
The tcpdump command is one of the most powerful network analysis tools available in Linux systems. It allows system administrators...
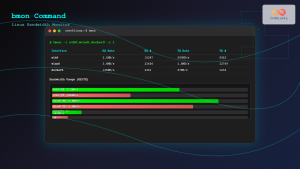
bmon Command Linux: Complete Guide to Real-Time Bandwidth Monitoring and Network Analysis
The bmon (Bandwidth Monitor) command is a powerful Linux utility designed for real-time network bandwidth monitoring and rate estimation. This...

cbm Command Linux: Monitor Network Bandwidth in Real-Time with Color Display
The cbm (Color Bandwidth Meter) command is a powerful Linux utility that provides real-time monitoring of network bandwidth usage with...


