
NagiosXI represents the pinnacle of enterprise network monitoring solutions on Linux systems, offering comprehensive infrastructure oversight with advanced alerting, reporting, and visualization capabilities. This powerful monitoring platform extends beyond basic Nagios Core functionality, providing a web-based interface, automated configuration wizards, and enterprise-grade features essential for modern IT operations.
Understanding NagiosXI Architecture
NagiosXI builds upon the proven Nagios Core engine while adding layers of functionality designed for enterprise environments. The architecture consists of several key components:
- Nagios Core Engine: The heart of the monitoring system that executes checks and processes results
- Web Interface: Modern GUI for configuration, monitoring, and reporting
- Configuration Manager: Simplified tools for managing complex monitoring configurations
- Reporting Engine: Advanced analytics and historical data presentation
- Alert System: Multi-channel notification capabilities
System Requirements and Prerequisites
Before installing NagiosXI, ensure your Linux system meets the minimum requirements:
# Check system specifications
cat /proc/cpuinfo | grep "model name" | head -1
free -h
df -h /
uname -a
Expected Output:
model name      : Intel(R) Core(TM) i7-8700K CPU @ 3.70GHz
              total        used        free      shared  buff/cache   available
Mem:           15Gi       2.1Gi        10Gi       234Mi       3.2Gi        12Gi
Filesystem      Size  Used Avail Use% Mounted on
/dev/sda1        50G  8.2G   39G  18% /
Linux server 5.4.0-74-generic #83-Ubuntu SMP x86_64 GNU/Linux
Minimum requirements include 2GB RAM, 20GB disk space, and a modern Linux distribution such as RHEL, CentOS, Ubuntu, or SUSE.
NagiosXI Installation Process
The installation process varies depending on your Linux distribution. Here’s the comprehensive installation procedure:
Installation on RHEL/CentOS
# Update system packages
sudo yum update -y

# Download NagiosXI installer
cd /tmp
wget https://assets.nagios.com/downloads/nagiosxi/xi-latest.tar.gz
tar xzf xi-latest.tar.gz
cd nagiosxi/

# Run the installation script
sudo ./fullinstall
Installation on Ubuntu/Debian
# Update package repositories
sudo apt update && sudo apt upgrade -y

# Install required dependencies
sudo apt install -y wget curl build-essential

# Download and extract NagiosXI
cd /tmp
wget https://assets.nagios.com/downloads/nagiosxi/xi-latest.tar.gz
tar xzf xi-latest.tar.gz
cd nagiosxi/

# Execute installation
sudo ./fullinstall
The installation process typically takes 15-30 minutes and includes automatic configuration of Apache, MySQL, PHP, and all necessary components.
Essential NagiosXI Commands and Operations
Once installed, NagiosXI provides numerous command-line utilities for management and troubleshooting:
Service Management Commands
# Check NagiosXI service status
sudo systemctl status nagios

# Start/Stop/Restart NagiosXI
sudo systemctl start nagios
sudo systemctl stop nagios
sudo systemctl restart nagios

# Enable automatic startup
sudo systemctl enable nagios
Expected Output for Status Check:
● nagios.service - Nagios Network Monitoring
   Loaded: loaded (/etc/systemd/system/nagios.service; enabled; vendor preset: enabled)
   Active: active (running) since Tue 2025-08-26 07:22:15 IST; 2h 15min ago
 Main PID: 1234 (nagios)
   CGroup: /system.slice/nagios.service
           └─1234 /usr/local/nagios/bin/nagios -d /usr/local/nagios/etc/nagios.cfg
Configuration Validation
# Verify Nagios configuration
sudo /usr/local/nagios/bin/nagios -v /usr/local/nagios/etc/nagios.cfg

# Check specific configuration files
sudo /usr/local/nagios/bin/nagios -p /usr/local/nagios/etc/nagios.cfg
Successful Validation Output:
Nagios Core 4.4.7
Copyright (c) 2009-2023 Nagios Core Development Team

Total Warnings: 0
Total Errors:   0

Things look okay - No serious problems were detected during the pre-flight check
Web Interface Access and Initial Configuration
After successful installation, access the NagiosXI web interface through your browser:
# Check Apache status
sudo systemctl status apache2

# Verify NagiosXI web accessibility
curl -I http://localhost/nagiosxi/
Navigate to http://your-server-ip/nagiosxi/ to access the web interface. The initial setup wizard guides you through:
- Administrative user creation
- Email notification configuration
- License activation (for commercial versions)
- Basic monitoring setup
Host and Service Configuration
NagiosXI offers multiple methods for configuring monitoring targets:
Command-Line Configuration
# Navigate to configuration directory
cd /usr/local/nagios/etc/objects/

# Create a new host configuration
sudo nano servers.cfg
Example host configuration:
define host {
    use             linux-server
    host_name       web-server-01
    alias           Web Server 01
    address         192.168.1.100
    contact_groups  admins
    notification_interval  30
    notification_period    24x7
}
Service Configuration
define service {
    use                     generic-service
    host_name               web-server-01
    service_description     HTTP
    check_command           check_http
    contact_groups          admins
    notification_interval   30
}
Advanced Monitoring Commands
NagiosXI provides extensive command-line tools for advanced monitoring operations:
Plugin Execution and Testing
# Test plugin functionality
sudo -u nagios /usr/local/nagios/libexec/check_ping -H 8.8.8.8 -w 100,20% -c 500,60%

# Check HTTP service
sudo -u nagios /usr/local/nagios/libexec/check_http -H example.com -w 5 -c 10

# Monitor disk space
sudo -u nagios /usr/local/nagios/libexec/check_disk -w 20% -c 10% -p /
Sample Plugin Output:
PING OK - Packet loss = 0%, RTA = 14.58ms|rta=14.580000ms;100.000000;500.000000;0.000000 pl=0%;20;60;0Performance Data Collection
# Enable performance data processing
sudo nano /usr/local/nagios/etc/nagios.cfg

# Add or modify these settings:
# process_performance_data=1
# host_perfdata_command=process-host-perfdata
# service_perfdata_command=process-service-perfdata
Alert Configuration and Management
Effective alerting is crucial for enterprise monitoring. Configure various notification methods:
Email Notifications
# Configure email settings
sudo nano /usr/local/nagios/etc/objects/commands.cfg

# Email command definition
define command {
    command_name    notify-host-by-email
    command_line    /usr/bin/printf "%b" "Host Alert: $HOSTNAME$ is $HOSTSTATE$\n\nTime: $LONGDATETIME$\nInfo: $HOSTOUTPUT$" | /usr/bin/mail -s "Host Alert: $HOSTNAME$ is $HOSTSTATE$" $CONTACTEMAIL$
}
SMS and Slack Integration
# Create custom notification script
sudo nano /usr/local/nagios/libexec/notify_slack.sh

#!/bin/bash
curl -X POST -H 'Content-type: application/json' \
--data "{\"text\":\"$1\"}" \
$SLACK_WEBHOOK_URL
Performance Optimization and Tuning
Optimize NagiosXI performance for large-scale deployments:
Configuration Optimization
# Optimize main configuration
sudo nano /usr/local/nagios/etc/nagios.cfg

# Key optimization settings:
# max_concurrent_checks=100
# check_result_reaper_frequency=5
# max_check_result_reaper_time=30
# cached_host_check_horizon=15
# cached_service_check_horizon=15
Database Optimization
# Optimize MySQL for NagiosXI
sudo nano /etc/mysql/mysql.conf.d/mysqld.cnf

# Add optimization settings:
# innodb_buffer_pool_size = 2G
# innodb_log_file_size = 256M
# query_cache_size = 128M
# max_connections = 500
Backup and Recovery Procedures
Implement comprehensive backup strategies for NagiosXI:
# Create backup script
sudo nano /usr/local/bin/nagios_backup.sh

#!/bin/bash
BACKUP_DIR="/backup/nagiosxi/$(date +%Y%m%d)"
mkdir -p $BACKUP_DIR

# Backup configuration files
tar -czf $BACKUP_DIR/nagios_config.tar.gz /usr/local/nagios/etc/

# Backup database
mysqldump -u root -p nagios > $BACKUP_DIR/nagios_db.sql
mysqldump -u root -p nagiosql > $BACKUP_DIR/nagiosql_db.sql

# Make script executable
sudo chmod +x /usr/local/bin/nagios_backup.sh
Troubleshooting Common Issues
Address frequent NagiosXI problems with systematic troubleshooting:
Service Check Failures
# Check Nagios logs
sudo tail -f /usr/local/nagios/var/nagios.log

# Verify plugin permissions
ls -la /usr/local/nagios/libexec/

# Test plugin execution manually
sudo -u nagios /usr/local/nagios/libexec/check_ping -H target_host
Web Interface Issues
# Check Apache error logs
sudo tail -f /var/log/apache2/error.log

# Verify PHP configuration
php -m | grep -E "(mysql|gd|ldap)"

# Check file permissions
sudo chown -R nagios:nagios /usr/local/nagios/
sudo chmod -R 755 /usr/local/nagios/
Security Best Practices
Implement robust security measures for your NagiosXI deployment:
SSL/TLS Configuration
# Enable SSL in Apache
sudo a2enmod ssl
sudo a2ensite default-ssl

# Generate SSL certificate
sudo openssl req -x509 -nodes -days 365 -newkey rsa:2048 \
-keyout /etc/ssl/private/nagios.key \
-out /etc/ssl/certs/nagios.crt
Firewall Configuration
# Configure UFW firewall
sudo ufw allow 22/tcp
sudo ufw allow 80/tcp
sudo ufw allow 443/tcp
sudo ufw allow 5666/tcp  # NRPE
sudo ufw enable
Monitoring Metrics and KPIs
Track essential performance indicators for your monitoring infrastructure:
- Check Execution Time: Monitor average and maximum execution times
- Alert Response Time: Track time between problem detection and notification
- System Resource Usage: Monitor CPU, memory, and disk usage of NagiosXI itself
- Check Success Rate: Percentage of successful monitoring checks
- False Positive Rate: Track and minimize unnecessary alerts
# Generate performance statistics
sudo /usr/local/nagios/bin/nagiostats -c /usr/local/nagios/etc/nagios.cfg
Integration with External Systems
Extend NagiosXI capabilities through integration with third-party tools:
REST API Usage
# Query host status via API
curl -k -u "username:password" \
"https://nagios-server/nagiosxi/api/v1/objects/host?apikey=YOUR_API_KEY"

# Acknowledge alerts programmatically
curl -k -X POST -u "username:password" \
-d "host_name=server01&comment=Acknowledged" \
"https://nagios-server/nagiosxi/api/v1/system/acknowledgement"
Conclusion
NagiosXI on Linux provides comprehensive enterprise network monitoring capabilities that scale from small businesses to large enterprise environments. Through proper installation, configuration, and management using the commands and techniques outlined in this guide, you can build a robust monitoring infrastructure that ensures high availability and performance of your critical systems.
Regular maintenance, security updates, and performance optimization ensure your NagiosXI deployment continues to provide reliable monitoring services. The combination of command-line flexibility and web-based management makes NagiosXI an ideal choice for organizations requiring both ease of use and advanced monitoring capabilities.
Remember to regularly review and update your monitoring configurations as your infrastructure evolves, and always maintain current backups of your NagiosXI configuration and historical data.
Related Posts
nagios Linux: Complete Infrastructure Monitoring System Setup Guide
Introduction to Nagios Nagios is one of the most popular open-source infrastructure monitoring systems available for Linux environments. Originally developed...
adagios Linux: Complete Guide to Web-Based Nagios Configuration Management
Managing Nagios configurations can be complex and time-consuming, especially when dealing with multiple hosts and services. adagios revolutionizes this process...
thruk Linux: Comprehensive Monitoring Web Interface for Network Infrastructure
Thruk is a powerful web-based monitoring interface designed primarily for Nagios and compatible monitoring systems. As a comprehensive frontend solution,...
op5 Linux: Complete Network Monitoring Solution Guide
op5 Linux is a comprehensive network monitoring solution built on top of the proven Nagios monitoring engine. This enterprise-grade platform...
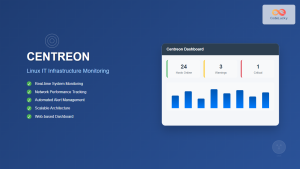
centreon Linux: Complete IT Infrastructure Monitoring Solution Guide
Centreon is a powerful, open-source IT infrastructure monitoring platform built on top of Nagios Core. It provides a comprehensive web-based...
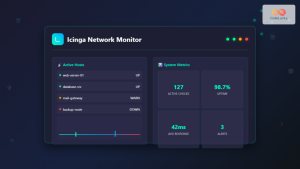
icinga Linux: Complete Network Monitoring System Guide for System Administrators
Icinga is a powerful open-source network monitoring system that helps system administrators monitor network resources, notify users of outages, and...
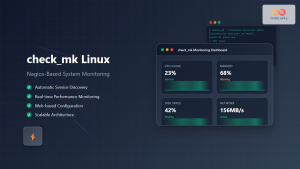
check_mk Linux: Complete Guide to Nagios-Based System Monitoring
check_mk is a powerful monitoring system built on top of Nagios that simplifies infrastructure monitoring with automated service discovery and...
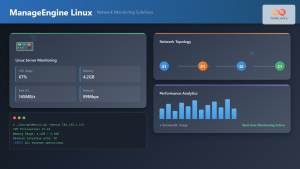
ManageEngine Linux: Complete Network Monitoring Solutions Guide
Network monitoring is crucial for maintaining optimal performance and security in Linux environments. ManageEngine provides powerful network monitoring solutions specifically...
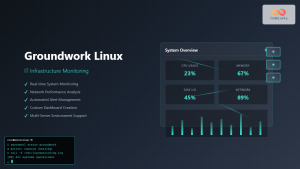
Groundwork Linux: Complete Guide to IT Infrastructure Monitoring and System Health Management
What is Groundwork Linux? Groundwork Linux is a comprehensive open-source IT infrastructure monitoring platform built specifically for Linux environments. It...
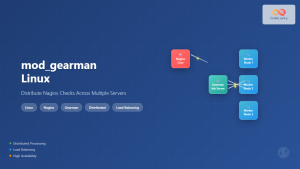
mod_gearman Linux: Complete Guide to Distributing Nagios Checks Across Multiple Servers
mod_gearman is a powerful Nagios module that enables you to distribute monitoring checks across multiple servers using the Gearman job...
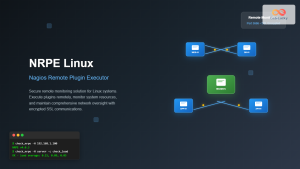
nrpe Linux: Complete Guide to Nagios Remote Plugin Executor Configuration and Usage
NRPE (Nagios Remote Plugin Executor) is a crucial component in the Nagios monitoring ecosystem that enables remote execution of monitoring...
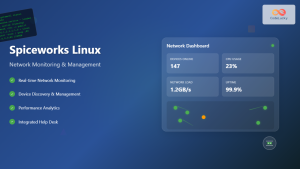
Spiceworks Linux: Complete Network Monitoring and Management Guide
Spiceworks is a powerful, free IT network monitoring and management platform that has revolutionized how system administrators handle their infrastructure....


