Introduction to Nagios
Nagios is one of the most popular open-source infrastructure monitoring systems available for Linux environments. Originally developed by Ethan Galstad in 1999, Nagios has evolved into a comprehensive monitoring solution that helps system administrators keep track of network services, host resources, and infrastructure components in real-time.
The name “Nagios” originally stood for “Nagios Ain’t Gonna Insist On Sainthood,” a recursive acronym that reflects the practical, no-nonsense approach of this monitoring tool. Today, Nagios serves as the backbone for monitoring critical infrastructure in organizations ranging from small businesses to large enterprises.
Key Features of Nagios
Nagios offers a comprehensive set of features that make it an excellent choice for infrastructure monitoring:
- Network Service Monitoring: Monitor HTTP, HTTPS, SMTP, POP3, NNTP, ICMP, SNMP, FTP, SSH, and other network protocols
- Host Resource Monitoring: Track processor load, disk usage, memory utilization, and running processes
- Simple Plugin Design: Allows users to easily develop custom service checks
- Parallelized Service Checks: Efficient monitoring through parallel execution
- Escalation and Notification System: Flexible alert mechanisms with multiple notification methods
- Web Interface: User-friendly web-based dashboard for monitoring and administration
- Optional Redundancy: Failover monitoring for critical systems
System Requirements
Before installing Nagios on your Linux system, ensure you meet the following requirements:
Hardware Requirements
- Minimum 2GB RAM (4GB recommended for larger environments)
- At least 20GB available disk space
- Multi-core processor (dual-core minimum)
Software Requirements
- Linux distribution (CentOS, RHEL, Ubuntu, Debian)
- Apache HTTP Server
- PHP (version 7.0 or later)
- GCC compiler
- GD library for image creation
Installing Nagios on Linux
Ubuntu/Debian Installation
First, update your system and install the required dependencies:
sudo apt update
sudo apt upgrade -y
sudo apt install -y apache2 php libapache2-mod-php php-gd libgd-dev
sudo apt install -y build-essential unzip wget openssl libssl-dev
Create a nagios user and group:
sudo useradd nagios
sudo groupadd nagcmd
sudo usermod -a -G nagcmd nagios
sudo usermod -a -G nagcmd www-data
Download and compile Nagios Core:
cd /tmp
wget https://github.com/NagiosEnterprises/nagioscore/archive/nagios-4.4.7.tar.gz
tar xzf nagios-4.4.7.tar.gz
cd nagioscore-nagios-4.4.7/
sudo ./configure --with-command-group=nagcmd
sudo make all
sudo make install
sudo make install-commandmode
sudo make install-init
sudo make install-config
sudo make install-webconf
CentOS/RHEL Installation
Install EPEL repository and required packages:
sudo yum install -y epel-release
sudo yum install -y httpd php gcc glibc glibc-common wget unzip
sudo yum install -y gd gd-devel make net-snmp openssl-devel xinetd
Create nagios user and group:
sudo useradd nagios
sudo groupadd nagcmd
sudo usermod -a -G nagcmd nagios
sudo usermod -a -G nagcmd apache
Follow the same compilation steps as Ubuntu, then start and enable services:
sudo systemctl start httpd
sudo systemctl enable httpd
sudo systemctl start nagios
sudo systemctl enable nagios
Installing Nagios Plugins
Nagios plugins are essential for monitoring various services and systems. Install the official plugin package:
cd /tmp
wget https://github.com/nagios-plugins/nagios-plugins/archive/release-2.3.3.tar.gz
tar xzf release-2.3.3.tar.gz
cd nagios-plugins-release-2.3.3/
sudo ./tools/setup
sudo ./configure
sudo make
sudo make install
Basic Nagios Configuration
Main Configuration File
The primary configuration file is located at /usr/local/nagios/etc/nagios.cfg. Key configuration parameters include:
# Main configuration file location
cfg_file=/usr/local/nagios/etc/objects/commands.cfg
cfg_file=/usr/local/nagios/etc/objects/contacts.cfg
cfg_file=/usr/local/nagios/etc/objects/timeperiods.cfg
cfg_file=/usr/local/nagios/etc/objects/templates.cfg

# Object configuration files
cfg_file=/usr/local/nagios/etc/objects/localhost.cfg

# Status file location
status_file=/usr/local/nagios/var/status.dat

# Command check interval
command_check_interval=-1

# Log file location
log_file=/usr/local/nagios/var/nagios.log
Web Interface Authentication
Create a web authentication user for the Nagios interface:
sudo htpasswd -c /usr/local/nagios/etc/htpasswd.users nagiosadminYou’ll be prompted to enter a password for the nagiosadmin user.
Configuring Host Monitoring
Adding a New Host
Create a new configuration file for your hosts in /usr/local/nagios/etc/objects/:
sudo nano /usr/local/nagios/etc/objects/servers.cfgAdd a host definition:
define host{
    use                     linux-server
    host_name              web-server-01
    alias                  Web Server 01
    address                192.168.1.100
    max_check_attempts     5
    check_period           24x7
    notification_interval  30
    notification_period    24x7
}
Host Groups Configuration
Organize hosts into logical groups:
define hostgroup{
    hostgroup_name  web-servers
    alias           Web Servers
    members         web-server-01,web-server-02
}
Service Monitoring Configuration
Basic Service Checks
Configure service monitoring for your hosts:
define service{
    use                     generic-service
    host_name              web-server-01
    service_description    HTTP
    check_command          check_http
    max_check_attempts     4
    normal_check_interval  5
    retry_check_interval   1
}
Custom Service Checks
Create custom service definitions for specific monitoring needs:
define service{
    use                     generic-service
    host_name              web-server-01
    service_description    MySQL Database
    check_command          check_mysql
    max_check_attempts     3
    normal_check_interval  10
    retry_check_interval   2
}
Notification Configuration
Contact Definitions
Configure contacts for receiving notifications:
define contact{
    contact_name                    admin
    alias                          System Administrator
    service_notification_period    24x7
    host_notification_period       24x7
    service_notification_options   w,u,c,r
    host_notification_options      d,u,r
    service_notification_commands  notify-service-by-email
    host_notification_commands     notify-host-by-email
    email                          [email protected]
}
Contact Groups
Create contact groups for organized notification management:
define contactgroup{
    contactgroup_name   admins
    alias               Nagios Administrators
    members             admin,backup-admin
}
Advanced Monitoring Examples
Disk Usage Monitoring
Monitor disk usage on remote hosts using NRPE:
define service{
    use                     generic-service
    host_name              web-server-01
    service_description    Root Partition
    check_command          check_nrpe!check_disk
    max_check_attempts     4
    normal_check_interval  5
}
Load Average Monitoring
Monitor system load average:
define service{
    use                     generic-service
    host_name              web-server-01
    service_description    Current Load
    check_command          check_nrpe!check_load
    max_check_attempts     4
    normal_check_interval  5
}
Memory Usage Monitoring
Track memory utilization:
define service{
    use                     generic-service
    host_name              web-server-01
    service_description    Memory Usage
    check_command          check_nrpe!check_mem
    max_check_attempts     4
    normal_check_interval  10
}
Command Definitions
Commands define how Nagios executes checks. Common command definitions include:
define command{
    command_name    check_http
    command_line    $USER1$/check_http -H $HOSTADDRESS$ $ARG1$
}

define command{
    command_name    check_ssh
    command_line    $USER1$/check_ssh $HOSTADDRESS$
}

define command{
    command_name    check_ping
    command_line    $USER1$/check_ping -H $HOSTADDRESS$ -w $ARG1$ -c $ARG2$ -p 5
}
NRPE Configuration
Installing NRPE
NRPE (Nagios Remote Plugin Executor) allows remote monitoring:
cd /tmp
wget https://github.com/NagiosEnterprises/nrpe/archive/nrpe-4.0.3.tar.gz
tar xzf nrpe-4.0.3.tar.gz
cd nrpe-nrpe-4.0.3/
sudo ./configure --enable-command-args
sudo make all
sudo make install
sudo make install-config
sudo make install-init
NRPE Configuration on Client
Configure NRPE on the client machine:
sudo nano /usr/local/nagios/etc/nrpe.cfgAdd allowed hosts and command definitions:
allowed_hosts=127.0.0.1,192.168.1.10
command[check_users]=/usr/local/nagios/libexec/check_users -w 5 -c 10
command[check_load]=/usr/local/nagios/libexec/check_load -w 15,10,5 -c 30,25,20
command[check_disk]=/usr/local/nagios/libexec/check_disk -w 20% -c 10% -p /
Web Interface Overview
Access the Nagios web interface through your browser at http://your-server-ip/nagios. The interface provides several key sections:
- Tactical Overview: Quick summary of system status
- Host Detail: Detailed information about monitored hosts
- Service Detail: Current status of all monitored services
- Host Groups: Organized view of host collections
- Service Groups: Grouped service monitoring
- Problems: Current issues requiring attention
Troubleshooting Common Issues
Configuration Verification
Always verify your configuration before restarting Nagios:
sudo /usr/local/nagios/bin/nagios -v /usr/local/nagios/etc/nagios.cfgExpected output for valid configuration:
Nagios Core 4.4.7
Copyright (c) 2009-present Nagios Core Development Team and Community Contributors
License: GPL

Website: https://www.nagios.org
Reading configuration data...
   Read main config file /usr/local/nagios/etc/nagios.cfg
   Processing object config files...

Total Warnings: 0
Total Errors: 0

Things look okay - No serious problems were detected during the pre-flight check
Permission Issues
Fix common permission problems:
sudo chown -R nagios:nagios /usr/local/nagios/
sudo chmod -R 755 /usr/local/nagios/
Service Start Issues
Check Nagios service status and logs:
sudo systemctl status nagios
sudo tail -f /usr/local/nagios/var/nagios.log
Performance Optimization
Check Interval Tuning
Optimize check intervals based on criticality:
define service{
    use                     generic-service
    host_name              critical-server
    service_description    Critical Service
    check_command          check_http
    normal_check_interval  1    # Check every minute
    retry_check_interval   1    # Retry immediately
}
Parallel Processing
Configure parallel processing for better performance:
# In nagios.cfg
max_concurrent_checks=20
check_result_reaper_frequency=10
Security Best Practices
Web Interface Security
Secure the web interface with SSL and strong authentication:
# Enable SSL in Apache configuration
sudo a2enmod ssl
sudo a2ensite default-ssl
File Permissions
Ensure proper file permissions for security:
sudo chmod 600 /usr/local/nagios/etc/htpasswd.users
sudo chown nagios:nagcmd /usr/local/nagios/var/rw/nagios.cmd
Backup and Recovery
Configuration Backup
Create regular backups of your Nagios configuration:
#!/bin/bash
BACKUP_DIR="/backup/nagios"
DATE=$(date +%Y%m%d_%H%M%S)
mkdir -p $BACKUP_DIR
tar -czf $BACKUP_DIR/nagios-config-$DATE.tar.gz /usr/local/nagios/etc/
Database Backup
If using Nagios with a database backend, include database backups:
mysqldump -u nagios -p nagios > /backup/nagios/nagios-db-$(date +%Y%m%d).sqlIntegration with Other Tools
Integration with Grafana
Nagios can be integrated with Grafana for enhanced visualization. Install the Nagios datasource plugin and configure connection parameters to display Nagios metrics in custom dashboards.
Log Integration
Configure log forwarding to centralized logging systems:
# Configure rsyslog to forward Nagios logs
echo "local0.*    @@logserver:514" >> /etc/rsyslog.conf
Conclusion
Nagios remains one of the most powerful and flexible monitoring solutions available for Linux environments. Its extensive plugin ecosystem, robust notification system, and comprehensive monitoring capabilities make it an excellent choice for organizations of all sizes.
The key to successful Nagios implementation lies in proper planning, configuration management, and regular maintenance. Start with basic monitoring of critical services and gradually expand your monitoring coverage as you become more familiar with the system.
Remember to regularly update your Nagios installation, review and optimize configurations, and maintain proper backup procedures to ensure continuous monitoring capability for your infrastructure.
Related Posts
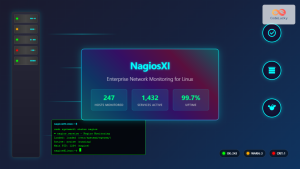
nagiosxi Linux: Complete Enterprise Network Monitoring Guide with Commands and Configuration
NagiosXI represents the pinnacle of enterprise network monitoring solutions on Linux systems, offering comprehensive infrastructure oversight with advanced alerting, reporting,...
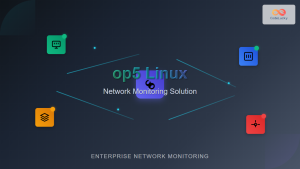
op5 Linux: Complete Network Monitoring Solution Guide
op5 Linux is a comprehensive network monitoring solution built on top of the proven Nagios monitoring engine. This enterprise-grade platform...
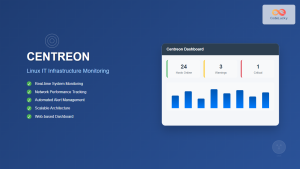
centreon Linux: Complete IT Infrastructure Monitoring Solution Guide
Centreon is a powerful, open-source IT infrastructure monitoring platform built on top of Nagios Core. It provides a comprehensive web-based...
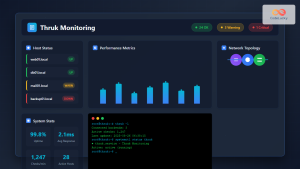
thruk Linux: Comprehensive Monitoring Web Interface for Network Infrastructure
Thruk is a powerful web-based monitoring interface designed primarily for Nagios and compatible monitoring systems. As a comprehensive frontend solution,...
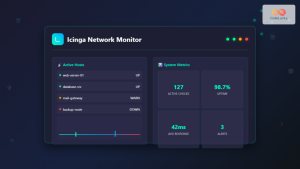
icinga Linux: Complete Network Monitoring System Guide for System Administrators
Icinga is a powerful open-source network monitoring system that helps system administrators monitor network resources, notify users of outages, and...
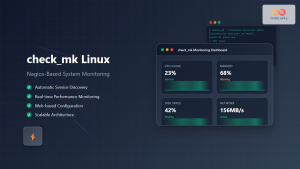
check_mk Linux: Complete Guide to Nagios-Based System Monitoring
check_mk is a powerful monitoring system built on top of Nagios that simplifies infrastructure monitoring with automated service discovery and...
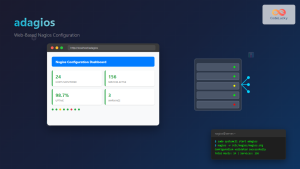
adagios Linux: Complete Guide to Web-Based Nagios Configuration Management
Managing Nagios configurations can be complex and time-consuming, especially when dealing with multiple hosts and services. adagios revolutionizes this process...
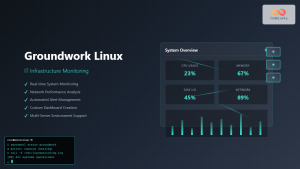
Groundwork Linux: Complete Guide to IT Infrastructure Monitoring and System Health Management
What is Groundwork Linux? Groundwork Linux is a comprehensive open-source IT infrastructure monitoring platform built specifically for Linux environments. It...
ManageEngine Linux: Complete Network Monitoring Solutions Guide
Network monitoring is crucial for maintaining optimal performance and security in Linux environments. ManageEngine provides powerful network monitoring solutions specifically...

whatsup Linux: Complete Network Monitoring and System Administration Guide
whatsup is a powerful network monitoring and system administration tool for Linux that provides real-time insights into network connectivity, system...
Zenoss Linux: Complete Guide to IT Infrastructure Monitoring and Management
What is Zenoss and Why Use it on Linux? Zenoss is a powerful, open-source IT infrastructure monitoring platform that provides...
Paessler Linux: Complete Guide to Network Monitoring with PRTG on Linux Systems
Network monitoring is crucial for maintaining optimal performance and security in Linux environments. Paessler PRTG Network Monitor offers comprehensive monitoring...