
Munin is a powerful networked resource monitoring tool for Linux systems that provides comprehensive insights into system performance, resource utilization, and network health. This open-source monitoring solution excels at tracking historical data and generating detailed graphs to help system administrators identify trends, bottlenecks, and potential issues before they become critical problems.
What is Munin Linux Monitoring Tool?
Munin operates on a master-node architecture where a central Munin master collects data from multiple Munin nodes across your network. Unlike real-time monitoring tools, Munin focuses on long-term trend analysis by collecting data at regular intervals (typically every 5 minutes) and storing it using RRDtool (Round Robin Database Tool).
The system consists of two main components:
- Munin Master: Collects data from nodes, generates graphs, and serves the web interface
- Munin Node: Runs on monitored systems and provides data to the master
Key Features and Benefits
Munin offers several advantages for network and system monitoring:
- Historical Data Analysis: Track performance trends over days, weeks, months, and years
- Extensive Plugin Library: Monitor CPU, memory, disk, network, databases, web servers, and more
- Web-based Interface: Access monitoring data through a clean, organized web dashboard
- Alerting System: Configure warnings and critical alerts for threshold violations
- Scalable Architecture: Monitor hundreds of nodes from a single master
- Low Resource Impact: Minimal system overhead during data collection
Installing Munin on Linux Systems
Installing Munin Master
On Ubuntu/Debian systems:
sudo apt update
sudo apt install munin munin-node apache2
On CentOS/RHEL systems:
sudo yum install epel-release
sudo yum install munin munin-node httpd
On Fedora systems:
sudo dnf install munin munin-node httpdInstalling Munin Node Only
For systems that will only send data to a master:
# Ubuntu/Debian
sudo apt install munin-node

# CentOS/RHEL
sudo yum install munin-node

# Fedora
sudo dnf install munin-node
Configuring Munin Master
The main configuration file for Munin master is located at /etc/munin/munin.conf. Here’s a basic configuration example:
# Global settings
[munin]
    dbdir   /var/lib/munin
    htmldir /var/cache/munin/www
    logdir  /var/log/munin
    rundir  /var/run/munin

# Web interface settings
tmpldir /etc/munin/templates
staticdir /etc/munin/static

# Data collection interval (seconds)
timeout 60

# Host definitions
[localhost.localdomain]
    address 127.0.0.1
    use_node_name yes

[webserver.example.com]
    address 192.168.1.100
    use_node_name yes

[database.example.com]
    address 192.168.1.101
    use_node_name yes
Apache Configuration for Munin
Create an Apache configuration file for Munin web interface:
sudo nano /etc/apache2/conf-available/munin.confAdd the following configuration:
Alias /munin /var/cache/munin/www

<Directory /var/cache/munin/www>
    Require local
    Options None

    # Allow access from specific networks
    # Require ip 192.168.1

    # Password protection (optional)
    # AuthType Basic
    # AuthName "Munin"
    # AuthUserFile /etc/munin/munin-htpasswd
    # Require valid-user
</Directory>
Enable the configuration:
sudo a2enconf munin
sudo systemctl reload apache2
Configuring Munin Node
The Munin node configuration file is located at /etc/munin/munin-node.conf:
# Basic node configuration
log_level 4
log_file /var/log/munin/munin-node.log
pid_file /var/run/munin/munin-node.pid

background 1
setsid 1

user root
group root

# Network settings
host 0.0.0.0
port 4949

# Allow connections from master
allow ^127\.0\.0\.1$
allow ^192\.168\.1\.10$

# Plugin directory
ignore_file [\#~]$
ignore_file SCCS$
ignore_file RCS$
ignore_file CVS$
ignore_file \.BAK$
ignore_file \.swp$
Managing Munin Services
Start and enable Munin services:
# On master server
sudo systemctl start munin-node
sudo systemctl enable munin-node
sudo systemctl start apache2
sudo systemctl enable apache2

# On node servers
sudo systemctl start munin-node
sudo systemctl enable munin-node
Check service status:
sudo systemctl status munin-nodeExpected output:
● munin-node.service - Munin Node
     Loaded: loaded (/lib/systemd/system/munin-node.service; enabled; vendor preset: enabled)
     Active: active (running) since Tue 2025-08-26 05:30:15 IST; 25min ago
       Docs: man:munin-node
   Main PID: 1234 (munin-node)
      Tasks: 1 (limit: 4915)
     Memory: 8.2M
        CPU: 2.341s
     CGroup: /system.slice/munin-node.service
             └─1234 /usr/sbin/munin-node
Understanding Munin Plugins
Munin uses plugins to collect different types of system data. Plugins are stored in /usr/share/munin/plugins/ and enabled by creating symbolic links in /etc/munin/plugins/.
Listing Available Plugins
munin-node-configure --suggestSample output:
Plugin                     | Used | Suggestions
---------------------------|------|---------------------------
cpu                        | yes  |
df                         | yes  |
diskstats                  | yes  |
entropy                    | yes  |
forks                      | yes  |
interrupts                 | yes  |
load                       | yes  |
memory                     | yes  |
netstat                    | yes  |
processes                  | yes  |
swap                       | yes  |
uptime                     | yes  |
users                      | yes  |
apache_accesses           | no   | apache_accesses
apache_processes          | no   | apache_processes
mysql_bytes               | no   | mysql_bytes
mysql_queries             | no   | mysql_queries
Enabling Plugins
Enable plugins automatically:
sudo munin-node-configure --shell | sudo shEnable specific plugins manually:
sudo ln -s /usr/share/munin/plugins/apache_accesses /etc/munin/plugins/
sudo ln -s /usr/share/munin/plugins/mysql_queries /etc/munin/plugins/
Testing Plugin Configuration
Test a specific plugin:
munin-run cpuExpected output:
user.value 1250
nice.value 0
system.value 890
idle.value 45230
iowait.value 120
irq.value 5
softirq.value 15
steal.value 0
guest.value 0
Common Munin Plugins and Their Usage
System Performance Plugins
| Plugin Name | Description | Key Metrics |
|---|---|---|
| cpu | CPU usage statistics | user, system, idle, iowait |
| memory | Memory utilization | used, free, cached, buffers |
| load | System load average | 1min, 5min, 15min load |
| df | Disk space usage | used/available space per filesystem |
| diskstats | Disk I/O statistics | read/write operations, throughput |
Network Monitoring Plugins
# Enable network interface monitoring
sudo ln -s /usr/share/munin/plugins/if_ /etc/munin/plugins/if_eth0
sudo ln -s /usr/share/munin/plugins/if_err_ /etc/munin/plugins/if_err_eth0
Apache Web Server Monitoring
Configure Apache for Munin monitoring by enabling mod_status:
sudo a2enmod statusAdd to Apache configuration:
<Location "/server-status">
    SetHandler server-status
    Require local
</Location>
Enable Apache plugins:
sudo ln -s /usr/share/munin/plugins/apache_accesses /etc/munin/plugins/
sudo ln -s /usr/share/munin/plugins/apache_processes /etc/munin/plugins/
sudo ln -s /usr/share/munin/plugins/apache_volume /etc/munin/plugins/
Creating Custom Munin Plugins
Create a simple custom plugin to monitor a specific service:
sudo nano /etc/munin/plugins/custom_serviceExample plugin script:
#!/bin/bash

case $1 in
   config)
        cat <<'EOM'
graph_title Custom Service Response Time
graph_args --base 1000 -l 0
graph_vlabel milliseconds
graph_category custom
response_time.label Response Time
response_time.draw LINE2
response_time.min 0
EOM
        exit 0;;
esac

# Measure response time (example)
RESPONSE_TIME=$(curl -s -w "%{time_total}" -o /dev/null http://localhost:8080/health | awk '{print $1*1000}')
echo "response_time.value $RESPONSE_TIME"
Make the plugin executable:
sudo chmod +x /etc/munin/plugins/custom_serviceMunin Web Interface Navigation
Access the Munin web interface at http://your-server/munin. The interface provides:
- Overview Page: Lists all monitored hosts with status indicators
- Host Details: Detailed graphs for individual hosts
- Time Ranges: View data for day, week, month, and year periods
- Graph Categories: Organized metrics by system, network, disk, etc.
Setting Up Alerts and Notifications
Configure warning and critical thresholds in plugin configurations:
# Example: CPU usage alert
sudo nano /etc/munin/plugin-conf.d/munin-node
Add configuration:
[cpu]
env.warning 80
env.critical 95

[memory]
env.warning 85
env.critical 95

[load]
env.warning 2.0
env.critical 4.0
Email Notifications
Configure email alerts in /etc/munin/munin.conf:
# Global alert settings
contact.admin.command mail -s "Munin Alert: ${var:group} ${var:host}" [email protected]
contact.admin.always_send warning critical
Troubleshooting Common Issues
Connection Problems
Test connectivity between master and node:
telnet node-server 4949If successful, you should see:
# munin node at node-server
list
quit
Plugin Issues
Debug plugin problems:
# Test plugin execution
sudo -u munin munin-run plugin_name

# Check plugin permissions
ls -la /etc/munin/plugins/plugin_name

# View error logs
sudo tail -f /var/log/munin/munin-node.log
Graph Generation Issues
Force graph update:
sudo -u munin munin-cron --force-updateCheck cron job status:
sudo -u munin /usr/bin/munin-cronPerformance Optimization
Reduce Data Collection Frequency
For less critical systems, increase collection interval in /etc/munin/munin.conf:
# Collect data every 10 minutes instead of 5
timeout 120
Limit Graph Generation
Reduce resource usage by limiting graph types:
graph_strategy cgi
html_strategy cgi
Security Considerations
Implement security best practices for Munin deployment:
- Firewall Configuration: Restrict access to port 4949
- Web Interface Protection: Use HTTP authentication
- SSL/TLS: Encrypt web traffic with HTTPS
- Network Restrictions: Limit node connections to known masters
Firewall Rules Example
# Allow Munin master connection
sudo ufw allow from 192.168.1.10 to any port 4949

# Allow web interface access
sudo ufw allow 80
sudo ufw allow 443
Monitoring Multiple Data Centers
For large-scale deployments, configure multiple Munin masters:
# Master 1 - Data Center A
[dc-a-web01]
    address 10.1.1.10
    use_node_name yes

[dc-a-db01]
    address 10.1.1.20
    use_node_name yes

# Master 2 - Data Center B
[dc-b-web01]
    address 10.2.1.10
    use_node_name yes
Best Practices for Munin Deployment
- Regular Maintenance: Clean old data and logs periodically
- Backup Configuration: Version control your Munin configurations
- Monitor the Monitor: Set up alerts for Munin service health
- Documentation: Document custom plugins and configurations
- Capacity Planning: Monitor disk space for RRD files
- Update Management: Keep Munin and plugins updated
Conclusion
Munin provides a robust, scalable solution for long-term system and network monitoring. Its strength lies in historical data analysis, extensive plugin ecosystem, and ease of deployment. While it may not be suitable for real-time alerting, Munin excels at trend analysis and capacity planning, making it an essential tool for system administrators managing multiple Linux servers.
By implementing proper configuration, security measures, and maintenance practices, Munin can provide years of reliable monitoring data to help optimize system performance and prevent potential issues before they impact your infrastructure.
Related Posts
Cacti Advanced Linux: Complete Guide to Enterprise Network Graphing and Monitoring
Cacti stands as one of the most powerful open-source network graphing solutions available for Linux systems, providing comprehensive network monitoring...

Cacti Linux: Complete Network Monitoring and Graphing Solution
Cacti is a comprehensive network graphing solution designed to harness the power of RRDtool's data storage and graphing functionality. Built...
ManageEngine Linux: Complete Network Monitoring Solutions Guide
Network monitoring is crucial for maintaining optimal performance and security in Linux environments. ManageEngine provides powerful network monitoring solutions specifically...
slurm Command Linux: Real-Time Network Traffic Monitor and Bandwidth Analyzer
The slurm command is a powerful network monitoring tool for Linux systems that provides real-time visualization of network traffic and...

Paessler Linux: Complete Guide to Network Monitoring with PRTG on Linux Systems
Network monitoring is crucial for maintaining optimal performance and security in Linux environments. Paessler PRTG Network Monitor offers comprehensive monitoring...
ganglia Linux: Complete Guide to Distributed Monitoring System
Ganglia is a powerful, open-source distributed monitoring system designed specifically for high-performance computing clusters, grids, and cloud infrastructures. Originally developed...
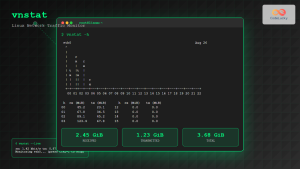
vnstat Command Linux: Complete Network Traffic Monitoring Guide
Network traffic monitoring is a crucial aspect of system administration, and the vnstat command in Linux provides an elegant solution...

Spiceworks Linux: Complete Network Monitoring and Management Guide
Spiceworks is a powerful, free IT network monitoring and management platform that has revolutionized how system administrators handle their infrastructure....
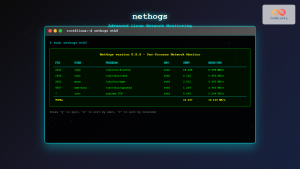
nethogs Advanced Linux: Complete Guide to Per-Process Network Monitoring
Network monitoring is crucial for system administrators and developers who need to track bandwidth usage and identify network-intensive processes. While...

nagiosxi Linux: Complete Enterprise Network Monitoring Guide with Commands and Configuration
NagiosXI represents the pinnacle of enterprise network monitoring solutions on Linux systems, offering comprehensive infrastructure oversight with advanced alerting, reporting,...
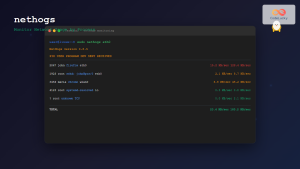
nethogs Command Linux: Monitor Real-Time Network Usage by Process
Network monitoring is a crucial aspect of system administration, especially when you need to identify which processes are consuming bandwidth...

whatsup Linux: Complete Network Monitoring and System Administration Guide
whatsup is a powerful network monitoring and system administration tool for Linux that provides real-time insights into network connectivity, system...


