
Metricbeat is a lightweight shipper that helps you monitor your systems and services by collecting metrics from the operating system and services running on the server. As part of the Elastic Stack (formerly ELK Stack), Metricbeat provides a powerful way to gather performance data and send it to Elasticsearch, Logstash, or other outputs for analysis and visualization.
What is Metricbeat?
Metricbeat is an open-source data shipper that periodically collects metrics from your systems and services. It’s designed to be lightweight and efficient, with minimal impact on system performance. Metricbeat can collect metrics from various sources including:
- System metrics (CPU, memory, disk, network)
- Service metrics (Apache, MySQL, Redis, Docker, etc.)
- Cloud platform metrics (AWS, Azure, GCP)
- Application metrics through custom modules
Key Features of Metricbeat
Lightweight Architecture
Metricbeat is built in Go, making it extremely lightweight with low resource consumption. It typically uses less than 40MB of memory and minimal CPU resources.
Modular Design
Metricbeat uses modules to collect metrics from different services. Each module contains one or more metricsets that gather specific types of data.
Pre-built Dashboards
Comes with pre-configured Kibana dashboards for popular services, making it easy to visualize collected metrics immediately.
Installing Metricbeat on Linux
Installation on Ubuntu/Debian
First, add the Elastic repository and install Metricbeat:
# Add Elastic's signing key
wget -qO - https://artifacts.elastic.co/GPG-KEY-elasticsearch | sudo apt-key add -

# Add the repository
echo "deb https://artifacts.elastic.co/packages/8.x/apt stable main" | sudo tee /etc/apt/sources.list.d/elastic-8.x.list

# Update package list and install
sudo apt update
sudo apt install metricbeat
Installation on CentOS/RHEL/Fedora
For RPM-based distributions:
# Add the Elastic repository
sudo rpm --import https://artifacts.elastic.co/GPG-KEY-elasticsearch

# Create repository file
sudo tee /etc/yum.repos.d/elastic.repo << EOF
[elastic-8.x]
name=Elastic repository for 8.x packages
baseurl=https://artifacts.elastic.co/packages/8.x/yum
gpgcheck=1
gpgkey=https://artifacts.elastic.co/GPG-KEY-elasticsearch
enabled=1
autorefresh=1
type=rpm-md
EOF

# Install Metricbeat
sudo yum install metricbeat
Direct Download Installation
You can also download and install Metricbeat directly:
# Download Metricbeat
curl -L -O https://artifacts.elastic.co/downloads/beats/metricbeat/metricbeat-8.10.0-linux-x86_64.tar.gz

# Extract the archive
tar xzvf metricbeat-8.10.0-linux-x86_64.tar.gz

# Move to appropriate directory
sudo mv metricbeat-8.10.0-linux-x86_64 /opt/metricbeat
Basic Configuration
Main Configuration File
The primary configuration file is located at /etc/metricbeat/metricbeat.yml. Here’s a basic configuration example:
# metricbeat.yml

# Metricbeat modules
metricbeat.config.modules:
  path: ${path.config}/modules.d/*.yml
  reload.enabled: true
  reload.period: 10s

# Elasticsearch output
output.elasticsearch:
  hosts: ["localhost:9200"]
  username: "elastic"
  password: "changeme"

# Kibana configuration
setup.kibana:
  host: "localhost:5601"

# Logging configuration
logging.level: info
logging.to_files: true
logging.files:
  path: /var/log/metricbeat
  name: metricbeat
  keepfiles: 7
  permissions: 0644
Enabling System Modules
Enable the system module to collect basic system metrics:
# Enable system module
sudo metricbeat modules enable system

# Verify enabled modules
sudo metricbeat modules list
Expected output:
Enabled:
system

Disabled:
apache
docker
mysql
nginx
redis
...
Configuring System Metrics Collection
System Module Configuration
The system module configuration file is located at /etc/metricbeat/modules.d/system.yml:
# system.yml
- module: system
  period: 10s
  metricsets:
    - cpu
    - load
    - memory
    - network
    - process
    - process_summary
    - socket_summary
    - entropy
    - core
    - diskio
    - socket
    - service
    - users
  enabled: true

  processes: ['.*']

  # Configure which network interfaces to monitor
  network.interfaces: ['eth0', 'lo']

  # CPU metrics configuration
  cpu.metrics: ["percentages", "normalized_percentages", "ticks"]

  # Process metrics configuration
  process.include_top_n:
    by_cpu: 5
    by_memory: 5
Filesystem Module
Enable filesystem monitoring:
# Enable filesystem module
sudo metricbeat modules enable system

# Configure filesystem monitoring in system.yml
- module: system
  period: 30s
  metricsets:
    - filesystem
    - fsstat
  enabled: true

  # Configure filesystem filters
  filesystem.ignore_types: ['tmpfs', 'devtmpfs', 'debugfs', 'cgroup', 'pstore', 'bpf', 'sysfs', 'proc']
Service-Specific Monitoring
Apache HTTP Server Monitoring
Enable and configure Apache monitoring:
# Enable Apache module
sudo metricbeat modules enable apache

# Configure Apache module in /etc/metricbeat/modules.d/apache.yml
- module: apache
  period: 10s
  hosts: ["http://127.0.0.1:80"]
  path: "/server-status"
  enabled: true
Ensure Apache mod_status is enabled:
# Enable mod_status in Apache configuration
sudo a2enmod status

# Add to Apache virtual host or main config
<Location "/server-status">
    SetHandler server-status
    Require local
</Location>
MySQL Database Monitoring
Configure MySQL monitoring:
# Enable MySQL module
sudo metricbeat modules enable mysql

# Configure MySQL module
- module: mysql
  period: 10s
  hosts: ["tcp(localhost:3306)/"]
  username: metricbeat_user
  password: password
  enabled: true
Create a MySQL user for Metricbeat:
CREATE USER 'metricbeat_user'@'localhost' IDENTIFIED BY 'password';
GRANT PROCESS, REPLICATION CLIENT, SELECT ON *.* TO 'metricbeat_user'@'localhost';
FLUSH PRIVILEGES;
Docker Container Monitoring
Monitor Docker containers:
# Enable Docker module
sudo metricbeat modules enable docker

# Configure Docker module
- module: docker
  period: 10s
  hosts: ["unix:///var/run/docker.sock"]
  enabled: true
  metricsets:
    - container
    - cpu
    - diskio
    - event
    - healthcheck
    - info
    - image
    - memory
    - network
Testing and Validation
Test Configuration
Before starting Metricbeat, test the configuration:
# Test configuration file
sudo metricbeat test config

# Test output connectivity
sudo metricbeat test output
Expected output for successful configuration test:
Config OKTest Data Collection
Run Metricbeat in foreground to see collected data:
# Run in foreground with debug output
sudo metricbeat -e -d "*"
This will show real-time metric collection output similar to:
2024-08-26T09:42:15.123Z INFO [beat] metricbeat/main.go:684 metricbeat start running.
2024-08-26T09:42:15.124Z INFO [monitoring] log/log.go:184 Starting metrics logging every 30s
2024-08-26T09:42:25.125Z INFO [monitoring] log/log.go:190 Non-zero metrics in the last 30s
  {"monitoring": {"metrics": {"beat":{"cpu":{"system":{"ticks":4,"time":{"ms":4}},"total":{"ticks":15,"time":{"ms":15},"value":15},"user":{"ticks":11,"time":{"ms":11}}},"info":{"ephemeral_id":"12345","uptime":{"ms":30001}},"memstats":{"gc_next":4194304,"memory_alloc":2097152,"memory_total":2097152},"runtime":{"goroutines":58}},"libbeat":{"config":{"module":{"running":3},"reloads":1},"output":{"events":{"acked":108,"batches":6,"total":108},"read":{"bytes":648},"write":{"bytes":36864}},"pipeline":{"clients":3,"events":{"active":0,"published":108,"total":108},"queue":{"acked":108}}},"metricbeat":{"system":{"cpu":{"events":3,"success":3},"load":{"events":3,"success":3},"memory":{"events":3,"success":3},"network":{"events":6,"success":6}}},"system":{"load":{"1":0.25,"15":0.18,"5":0.21,"norm":{"1":0.0625,"15":0.045,"5":0.0525}}}}}
Starting and Managing Metricbeat
Service Management
Start and enable Metricbeat service:
# Start Metricbeat service
sudo systemctl start metricbeat

# Enable auto-start on boot
sudo systemctl enable metricbeat

# Check service status
sudo systemctl status metricbeat
Expected status output:
● metricbeat.service - Metricbeat is a lightweight shipper for metrics
   Loaded: loaded (/lib/systemd/system/metricbeat.service; enabled; vendor preset: enabled)
   Active: active (running) since Tue 2024-08-26 09:42:15 IST; 5min ago
     Docs: https://www.elastic.co/products/beats/metricbeat
 Main PID: 12345 (metricbeat)
    Tasks: 15 (limit: 4915)
   Memory: 35.2M
   CGroup: /system.slice/metricbeat.service
           └─12345 /usr/share/metricbeat/bin/metricbeat -environment systemd -c /etc/metricbeat/metricbeat.yml --path.home /usr/share/metricbeat --path.config /etc/metricbeat --path.data /var/lib/metricbeat --path.logs /var/log/metricbeat
Log Monitoring
Monitor Metricbeat logs:
# View recent logs
sudo journalctl -u metricbeat -f

# View logs with timestamp
sudo journalctl -u metricbeat --since "1 hour ago"
Advanced Configuration
Custom Fields and Tags
Add custom fields and tags to your metrics:
# Add to metricbeat.yml
fields:
  environment: production
  datacenter: dc1

fields_under_root: true

tags: ["production", "web-server", "frontend"]

processors:
  - add_host_metadata:
      when.not.contains.tags: forwarded
  - add_docker_metadata: ~
  - add_kubernetes_metadata: ~
Multiple Outputs
Configure multiple outputs for redundancy:
# Multiple Elasticsearch hosts
output.elasticsearch:
  hosts: ["es-node1:9200", "es-node2:9200", "es-node3:9200"]
  loadbalance: true

# Alternative: Logstash output
#output.logstash:
#  hosts: ["logstash1:5044", "logstash2:5044"]
Data Filtering and Processing
Configure processors to filter and modify data:
processors:
  - include_fields:
      fields: ["system.cpu", "system.memory", "system.load"]

  - drop_event:
      when:
        equals:
          system.process.name: "idle"

  - script:
      lang: javascript
      id: my_filter
      source: >
        function process(event) {
          if (event.Get("system.cpu.user.pct") > 0.8) {
            event.Put("alert.high_cpu", true);
          }
          return event;
        }
Performance Optimization
Tuning Collection Intervals
Optimize collection periods based on your needs:
# High-frequency monitoring for critical metrics
- module: system
  period: 5s
  metricsets: ["cpu", "memory"]

# Lower frequency for less critical metrics
- module: system
  period: 60s
  metricsets: ["filesystem", "users"]
Memory and CPU Optimization
Configure resource limits:
# Queue settings
queue.mem:
  events: 4096
  flush.min_events: 512
  flush.timeout: 5s

# Bulk size for Elasticsearch
output.elasticsearch:
  bulk_max_size: 1600
  worker: 1
Monitoring and Alerting
Setting up Index Templates
Create index templates for better data organization:
# Setup index template and dashboards
sudo metricbeat setup --template --dashboards

# Setup with specific Elasticsearch instance
sudo metricbeat setup --template --dashboards -E output.elasticsearch.hosts=["elasticsearch:9200"]
Custom Dashboards
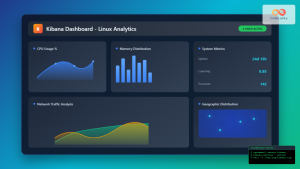
After setting up Kibana dashboards, you can create custom visualizations for:
- CPU usage trends over time
- Memory consumption patterns
- Disk I/O performance
- Network traffic analysis
- Service availability monitoring
Troubleshooting Common Issues
Connection Issues
If Metricbeat cannot connect to Elasticsearch:
# Check connectivity
curl -X GET "localhost:9200/_cluster/health?pretty"

# Verify credentials
curl -u elastic:password -X GET "localhost:9200/_cluster/health?pretty"

# Check Metricbeat logs
sudo journalctl -u metricbeat | grep ERROR
Permission Issues
Fix common permission problems:
# Ensure proper ownership
sudo chown -R root:root /etc/metricbeat/
sudo chown -R metricbeat:metricbeat /var/lib/metricbeat/
sudo chown -R metricbeat:metricbeat /var/log/metricbeat/

# Set correct permissions
sudo chmod 600 /etc/metricbeat/metricbeat.yml
High Resource Usage
If Metricbeat is consuming too many resources:
# Increase collection periods
period: 30s  # Instead of 10s

# Reduce metricsets
metricsets: ["cpu", "memory"]  # Only essential metrics

# Limit process monitoring
processes: ['httpd', 'mysqld', 'nginx']  # Specific processes only
Security Best Practices
SSL/TLS Configuration
Configure secure communication:
output.elasticsearch:
  hosts: ["https://localhost:9200"]
  ssl.certificate_authorities: ["/path/to/ca.crt"]
  ssl.certificate: "/path/to/client.crt"
  ssl.key: "/path/to/client.key"
User Authentication
Use dedicated service accounts:
# Create dedicated user in Elasticsearch
POST /_security/user/metricbeat_writer
{
  "password": "strong_password",
  "roles": ["metricbeat_writer"],
  "full_name": "Metricbeat Service Account"
}
Conclusion
Metricbeat provides a powerful and lightweight solution for collecting system and service metrics on Linux systems. Its modular architecture, extensive configuration options, and integration with the Elastic Stack make it an excellent choice for monitoring infrastructure and applications.
Key benefits of using Metricbeat include:
- Minimal resource overhead
- Comprehensive metric collection
- Easy configuration and management
- Rich visualization capabilities with Kibana
- Scalable architecture for large deployments
By following the configurations and best practices outlined in this guide, you can effectively monitor your Linux systems and gain valuable insights into system performance and service health. Regular monitoring with Metricbeat helps identify performance bottlenecks, plan capacity upgrades, and maintain optimal system performance.
Remember to regularly update Metricbeat to benefit from new features, bug fixes, and security improvements. Additionally, consider implementing proper backup strategies for your configuration files and establishing monitoring for the monitoring system itself to ensure continuous operation.
Related Posts
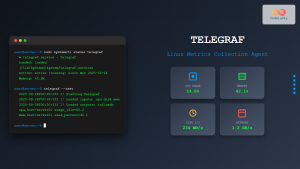
Telegraf Linux: Complete Guide to Installing and Configuring the Metrics Collection Agent
Telegraf is a powerful, plugin-driven server agent for collecting and reporting metrics from databases, systems, and IoT sensors. As part...
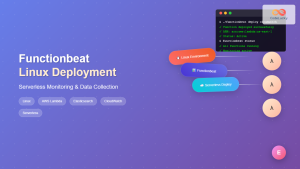
Functionbeat Linux: Complete Guide to Serverless Deployment and Monitoring
Functionbeat represents a revolutionary approach to serverless monitoring and data collection in modern cloud environments. As part of the Elastic...
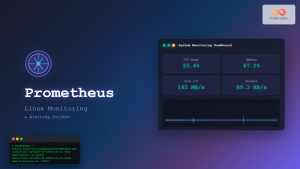
Prometheus Linux: Complete Monitoring and Alerting Toolkit Guide
Prometheus has revolutionized the way we monitor and alert on modern infrastructure. As an open-source monitoring toolkit originally built at...
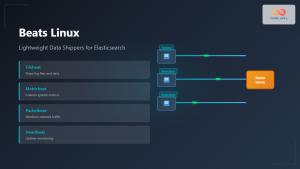
Beats Linux: Complete Guide to Data Shippers for Elasticsearch Integration
Beats are lightweight, open-source data shippers developed by Elastic that collect different types of data from your systems and forward...
Kibana Linux: Complete Guide to Data Visualization Dashboard Setup and Management
Kibana is a powerful open-source data visualization and exploration tool that works seamlessly with Elasticsearch to provide interactive dashboards and...
auditbeat Linux: Complete Guide to Shipping Audit Data to Elasticsearch
Introduction to auditbeat auditbeat is a lightweight shipper from the Elastic Beat family that collects audit data from the Linux...
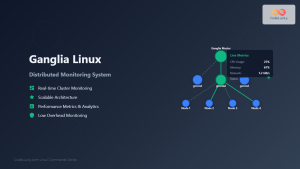
ganglia Linux: Complete Guide to Distributed Monitoring System
Ganglia is a powerful, open-source distributed monitoring system designed specifically for high-performance computing clusters, grids, and cloud infrastructures. Originally developed...
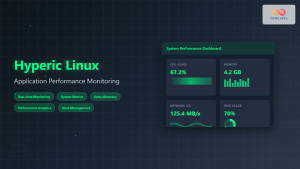
Hyperic Linux: Complete Guide to Application Performance Monitoring and System Optimization
Hyperic is a powerful open-source application performance monitoring (APM) platform that provides comprehensive insights into your Linux systems and applications....
filebeat Linux: Complete Guide to Ship Log Files to Elasticsearch with Real Examples
Filebeat is a lightweight log shipper that belongs to the Elastic Stack (formerly ELK Stack) ecosystem. It's designed to monitor...
Groundwork Linux: Complete Guide to IT Infrastructure Monitoring and System Health Management
What is Groundwork Linux? Groundwork Linux is a comprehensive open-source IT infrastructure monitoring platform built specifically for Linux environments. It...
collectd Linux: Complete Guide to System Statistics Collection Daemon
The collectd daemon is a powerful system statistics collection tool for Linux that gathers performance metrics from various system components...
packetbeat Linux: Complete Network Packet Analysis Tool Guide
Network packet analysis is crucial for system administrators, security professionals, and developers who need to monitor, troubleshoot, and secure network...


