
The ltrace command is a powerful debugging and analysis tool in Linux that allows you to trace library calls made by programs. Unlike strace which traces system calls, ltrace focuses specifically on dynamic library function calls, making it invaluable for understanding how programs interact with shared libraries.
What is ltrace?
ltrace intercepts and records dynamic library calls made by a process and the signals received by that process. It’s particularly useful for:
- Debugging application behavior
- Understanding library dependencies
- Performance analysis
- Security auditing
- Educational purposes to learn how programs work
Installing ltrace
Most Linux distributions include ltrace by default. If it’s not installed, you can install it using your package manager:
# Ubuntu/Debian
sudo apt-get install ltrace

# CentOS/RHEL/Fedora
sudo yum install ltrace
# or
sudo dnf install ltrace

# Arch Linux
sudo pacman -S ltrace
Basic ltrace Syntax
The basic syntax of ltrace is:
ltrace [options] command [arguments]
ltrace [options] -p pid
Essential ltrace Options
| Option | Description |
|---|---|
-c |
Count time, calls, and errors for each library call |
-p PID |
Attach to existing process with given PID |
-f |
Trace child processes as they are created |
-o filename |
Write output to specified file |
-t |
Prefix each line with time of day |
-r |
Print relative timestamp for each call |
-s size |
Maximum string size to display |
-n depth |
Maximum number of nested calls to follow |
Basic ltrace Examples
Tracing a Simple Program
Let’s start with a basic example tracing the ls command:
ltrace lsSample Output:
__libc_start_main(0x403e10, 1, 0x7fff89c5e5c8, 0x40bbc0 <unfinished ...>
strrchr("ls", '/') = nil
setlocale(LC_ALL, "") = "en_US.UTF-8"
bindtextdomain("coreutils", "/usr/share/locale") = "/usr/share/locale"
textdomain("coreutils") = "coreutils"
__cxa_atexit(0x4025c0, 0, 0, 0x736c6163656e6f) = 0
isatty(1) = 1
getenv("QUOTING_STYLE") = nil
getenv("COLUMNS") = nil
ioctl(1, 21523, 0x7fff89c5e3c0) = 0
getenv("TABSIZE") = nil
getenv("LS_COLORS") = "rs=0:di=01;34:ln=01;36:mh=00:pi=40..."
malloc(4096) = 0x1234567890ab
opendir(".") = 0x1234567890cd
readdir(0x1234567890cd) = 0x1234567890ef
strlen("file1.txt") = 9
strcmp("file1.txt", ".") = 102
strcmp("file1.txt", "..") = 102
Tracing with Process ID
To trace an already running process:
# First, find the process ID
ps aux | grep firefox

# Then trace it
sudo ltrace -p 1234
Advanced ltrace Usage
Counting Library Calls
Use the -c option to get statistics about library calls:
ltrace -c ls /homeSample Output:
% time     seconds  usecs/call     calls      function
------ ----------- ----------- --------- --------------------
 18.75    0.000045          45         1 __libc_start_main
 14.58    0.000035           7         5 malloc
 12.50    0.000030           6         5 strlen
 10.42    0.000025           5         5 strcmp
  8.33    0.000020           4         5 readdir
  6.25    0.000015           3         5 opendir
  4.17    0.000010           2         5 closedir
------ ----------- ----------- --------- --------------------
100.00    0.000240                    36 total
Filtering Specific Library Calls
You can filter specific library functions using -e option:
# Trace only malloc and free calls
ltrace -e malloc,free ./myprogram

# Trace all calls except printf family
ltrace -e '!printf*' ./myprogram
Following Child Processes
Use -f to trace child processes:
ltrace -f ./parent_programAdding Timestamps
Add timestamps to understand timing:
# Absolute timestamps
ltrace -t ls

# Relative timestamps (time since previous call)
ltrace -r ls
Sample Output with timestamps:
09:15:23 __libc_start_main(0x403e10, 1, 0x7fff89c5e5c8, 0x40bbc0 <unfinished ...>
09:15:23 strrchr("ls", '/') = nil
09:15:23 setlocale(LC_ALL, "") = "en_US.UTF-8"
09:15:23 bindtextdomain("coreutils", "/usr/share/locale") = "/usr/share/locale"
Practical Use Cases
Debugging Memory Leaks
Track memory allocation and deallocation:
ltrace -e 'malloc,free,calloc,realloc' ./myprogramThis helps identify memory allocation patterns and potential leaks.
Analyzing File Operations
Monitor file-related library calls:
ltrace -e 'fopen,fread,fwrite,fclose' ./file_processorDebugging String Operations
Focus on string manipulation functions:
ltrace -e 'strcpy,strcat,strlen,strcmp,strchr' ./string_programSaving and Analyzing Output
Writing Output to File
# Save trace to file
ltrace -o trace_output.txt ls /home

# View the saved trace
cat trace_output.txt
Combining with Other Tools
# Count specific function calls
ltrace -c ls 2>&1 | grep malloc

# Find most called functions
ltrace -c ./myprogram 2>&1 | sort -k4 -nr
ltrace vs strace Comparison
| Feature | ltrace | strace |
|---|---|---|
| Focus | Library function calls | System calls |
| Level | User space | Kernel space |
| Overhead | Lower | Higher |
| Use Case | Application debugging | System-level debugging |
Common ltrace Patterns
Creating a Simple C Program for Testing
// test.c
#include <stdio.h>
#include <stdlib.h>
#include <string.h>

int main() {
    char *buffer = malloc(100);
    strcpy(buffer, "Hello, ltrace!");
    printf("%s\n", buffer);
    free(buffer);
    return 0;
}
Compile and trace:
gcc -o test test.c
ltrace ./test
Expected Output:
__libc_start_main(0x401126, 1, 0x7ffee8f3e5c8, 0x401180 <unfinished ...>
malloc(100) = 0x55a8f4f032a0
strcpy(0x55a8f4f032a0, "Hello, ltrace!") = 0x55a8f4f032a0
puts("Hello, ltrace!") = 15
Hello, ltrace!
free(0x55a8f4f032a0) = <void>
+++ exited (status 0) +++
Performance Considerations
When using ltrace, keep in mind:
- Performance Impact: ltrace adds overhead to program execution
- Output Volume: Large programs can generate massive amounts of output
- Security: Traces may contain sensitive information
- Root Privileges: Required for tracing processes owned by other users
Troubleshooting Common Issues
Permission Denied
If you encounter permission issues:
sudo ltrace -p PIDToo Much Output
Limit output using filters:
# Limit string display length
ltrace -s 10 ./program

# Filter specific functions
ltrace -e 'malloc,free' ./program
Program Doesn’t Start
Some programs might not start under ltrace due to security restrictions:
# Try with reduced security
ltrace --no-signals ./program
Best Practices
- Start with specific filters to avoid overwhelming output
- Use counting mode (-c) for performance analysis
- Combine with strace for comprehensive debugging
- Save output to files for later analysis
- Test on development systems before production use
Conclusion
The ltrace command is an essential tool for Linux developers and system administrators. It provides invaluable insights into how programs interact with dynamic libraries, making it easier to debug issues, understand program behavior, and optimize performance. By mastering ltrace along with its various options and use cases, you can significantly improve your ability to troubleshoot and analyze Linux applications.
Whether you’re debugging memory leaks, analyzing file operations, or simply trying to understand how a program works, ltrace provides the visibility you need into library function calls. Combined with other debugging tools like strace and gdb, it forms part of a comprehensive toolkit for Linux system analysis and debugging.
Related Posts
strace Advanced Linux: Complete Guide to System Call Tracing and Debugging
strace is one of the most powerful debugging and diagnostic tools available in Linux systems. It allows you to trace...
ptrace Command Linux: Complete Guide to Process Tracing System Call
The ptrace system call is one of Linux's most powerful tools for process monitoring and debugging. It allows one process...
strace Command Linux: Complete Guide to System Call Tracing and Debugging
The strace command is one of the most powerful debugging and monitoring tools available in Linux systems. It allows you...
valgrind Command Linux: Complete Memory Debugging and Profiling Guide
Valgrind is one of the most powerful and essential tools for Linux developers and system administrators who need to debug...
readelf Command Linux: Complete Guide to ELF File Analysis and Debugging
The readelf command is an essential tool for Linux developers, system administrators, and security analysts who need to examine Executable...
gdb Command Linux: Complete GNU Debugger Tutorial for Developers
The GNU Debugger (GDB) is one of the most powerful and essential tools for developers working on Linux systems. As...
perf Command Linux: Complete Performance Analysis and Profiling Guide
The perf command is one of the most powerful performance analysis tools available in Linux, offering comprehensive insights into system...
size Command Linux: Display Section Sizes of Object Files and Executables
The size command is a powerful utility in Linux systems that displays the section sizes of object files, executables, and...
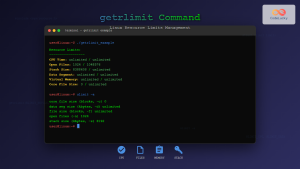
getrlimit Command Linux: Complete Guide to System Resource Limits Management
The getrlimit system call in Linux is a fundamental tool for retrieving information about resource limits imposed on processes. Understanding...
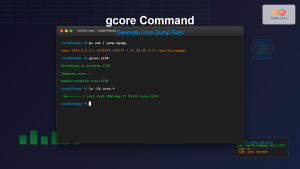
gcore Command Linux: Complete Guide to Generate Core Dump Files for Debugging
The gcore command in Linux is a powerful debugging tool that generates core dump files from running processes without terminating...
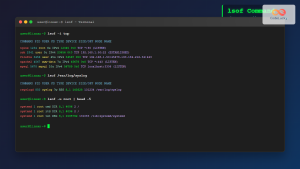
lsof Command Linux: Complete Guide to List Open Files and Running Processes
The lsof command (List Open Files) is one of the most powerful and versatile utilities in Linux systems. It provides...
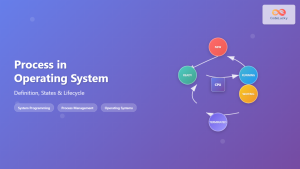
Process in Operating System: Complete Guide to Definition, States and Lifecycle
What is a Process in Operating System? A process is a program in execution that consists of the program code...


