The journalctl command is one of the most powerful tools in modern Linux systems for viewing and analyzing system logs. As part of the systemd init system, it provides a unified interface to query the systemd journal, which collects and stores logging data from various sources including the kernel, services, and applications.
Unlike traditional syslog files scattered across /var/log/, the systemd journal stores logs in a binary format that can be efficiently queried, filtered, and searched. This comprehensive guide will teach you everything you need to know about using journalctl effectively.
What is journalctl?
journalctl is the command-line utility for querying the systemd journal. The systemd journal is a centralized logging system that collects log messages from:
- Kernel messages
- System services
- User applications
- Boot messages
- Authentication events
- Hardware events
The journal stores logs in binary format in files located at /var/log/journal/ or /run/log/journal/, depending on your system configuration.
Basic journalctl Syntax
The basic syntax for journalctl is:
journalctl [OPTIONS] [MATCHES]Let’s start with the most fundamental usage examples.
Essential journalctl Commands
View All Logs
To view all available logs in the journal:
journalctlThis command displays all logs from oldest to newest. The output will be paginated using your system’s default pager (usually less).
View Recent Logs
To see the most recent logs without scrolling through everything:
journalctl -n 20This shows the last 20 log entries. You can replace 20 with any number you prefer.
Follow Logs in Real-time
Similar to tail -f, you can follow logs as they’re written:
journalctl -fThis is extremely useful for monitoring system activity in real-time or debugging issues as they occur.
Filtering Logs by Time
One of journalctl’s most powerful features is its ability to filter logs by time periods.
Today’s Logs
journalctl --since todayYesterday’s Logs
journalctl --since yesterday --until todaySpecific Date Range
journalctl --since "2024-01-01" --until "2024-01-31"Time-specific Filtering
journalctl --since "2024-01-15 10:00:00" --until "2024-01-15 11:00:00"Relative Time Filtering
# Last hour
journalctl --since "1 hour ago"

# Last 30 minutes
journalctl --since "30 minutes ago"

# Last week
journalctl --since "1 week ago"
Filtering by Priority Levels
journalctl uses standard syslog priority levels. You can filter logs by their importance:
Priority Levels
- 0 (emerg): Emergency – system unusable
- 1 (alert): Alert – immediate action required
- 2 (crit): Critical conditions
- 3 (err): Error conditions
- 4 (warning): Warning conditions
- 5 (notice): Normal but significant conditions
- 6 (info): Informational messages
- 7 (debug): Debug-level messages
View Only Errors and Above
journalctl -p errView Warnings and Above
journalctl -p warningView Specific Priority Range
journalctl -p crit..errService-Specific Logs
To view logs for specific systemd services:
Single Service
journalctl -u nginx.serviceMultiple Services
journalctl -u nginx.service -u mysql.serviceFollow Service Logs
journalctl -u nginx.service -fService Logs for Today
journalctl -u nginx.service --since todayKernel Messages
To view kernel messages (similar to dmesg):
journalctl -kFor kernel messages from current boot:
journalctl -k -bBoot-Specific Logs
journalctl can show logs from different boot sessions:
Current Boot
journalctl -bPrevious Boot
journalctl -b -1List Available Boots
journalctl --list-bootsThis shows available boot sessions with their IDs:
-2 3c3c03b... Mon 2024-01-15 08:45:33 IST—Mon 2024-01-15 23:59:59 IST
-1 4d4d04c... Tue 2024-01-16 08:30:15 IST—Tue 2024-01-16 23:45:22 IST
 0 5e5e05d... Wed 2024-01-17 09:15:42 IST—Wed 2024-01-17 17:30:18 IST
Specific Boot Session
journalctl -b 4d4d04c...User and Process-Specific Logs
Logs for Specific User
journalctl _UID=1000Logs for Specific Process ID
journalctl _PID=1234Logs for Specific Executable
journalctl /usr/bin/nginxAdvanced Filtering and Search
Search for Specific Text
journalctl | grep "error"Or use journalctl’s built-in pattern matching:
journalctl -g "error|failed|critical"Field-based Filtering
You can filter based on journal fields:
# Filter by hostname
journalctl _HOSTNAME=webserver

# Filter by systemd unit
journalctl _SYSTEMD_UNIT=nginx.service

# Filter by transport
journalctl _TRANSPORT=kernel
Multiple Field Filters
journalctl _SYSTEMD_UNIT=nginx.service _PID=1234Output Formatting Options
JSON Output
journalctl -o jsonJSON Pretty Format
journalctl -o json-prettyShort Format
journalctl -o shortVerbose Format
journalctl -o verboseExport Format
journalctl -o exportManaging Journal Size and Persistence
Check Journal Disk Usage
journalctl --disk-usageVacuum Journal by Size
sudo journalctl --vacuum-size=100MVacuum Journal by Time
sudo journalctl --vacuum-time=1monthVacuum Journal by Number of Files
sudo journalctl --vacuum-files=5Practical Examples and Use Cases
Debugging System Boot Issues
# Check last boot logs for errors
journalctl -b -p err

# Check specific service during boot
journalctl -b -u systemd-networkd.service
Monitoring Web Server
# Follow nginx logs in real-time
journalctl -u nginx.service -f

# Check nginx errors from last hour
journalctl -u nginx.service --since "1 hour ago" -p err
Security Monitoring
# Check authentication logs
journalctl _COMM=sshd

# Failed login attempts
journalctl -g "Failed password" --since today
System Performance Analysis
# Check for out-of-memory events
journalctl -g "Out of memory"

# Check for hardware issues
journalctl -k -g "error|fail"
Configuration and Customization
The journal configuration is managed through /etc/systemd/journald.conf:
# Key configuration options
Storage=persistent         # Store logs persistently
Compress=yes              # Compress log files
MaxRetentionSec=1month    # Keep logs for 1 month
MaxFileSec=1week          # Rotate files weekly
RateLimitBurst=10000      # Rate limiting
Tips and Best Practices
Performance Tips
- Use specific filters to reduce output volume
- Combine time filters with service filters for efficiency
- Use
-nto limit output when you only need recent entries - Consider using
--no-pagerin scripts
Useful Aliases
Add these to your shell configuration for quick access:
alias jc='journalctl'
alias jcf='journalctl -f'
alias jce='journalctl -p err'
alias jcb='journalctl -b'
Scripting with journalctl
For shell scripts, use these options:
#!/bin/bash
# Get error count from last hour
error_count=$(journalctl --since "1 hour ago" -p err --no-pager -q | wc -l)
echo "Errors in last hour: $error_count"
Common Issues and Troubleshooting
Permission Issues
If you get permission denied errors, you might need to:
# Add user to systemd-journal group
sudo usermod -a -G systemd-journal username

# Or use sudo
sudo journalctl
No Logs Available
If journals appear empty:
- Check if journald service is running:
systemctl status systemd-journald - Verify storage configuration in
/etc/systemd/journald.conf - Check disk space availability
Integration with Other Tools
Combining with grep and awk
# Extract IP addresses from failed SSH attempts
journalctl -g "Failed password" | grep -o '[0-9]\{1,3\}\.[0-9]\{1,3\}\.[0-9]\{1,3\}\.[0-9]\{1,3\}'
Log Analysis with JSON
# Extract specific fields using jq
journalctl -o json | jq '.MESSAGE'
Conclusion
The journalctl command is an indispensable tool for Linux system administrators and developers. Its powerful filtering capabilities, real-time monitoring features, and structured log format make it superior to traditional log file analysis methods. By mastering journalctl, you can efficiently troubleshoot issues, monitor system performance, and maintain better visibility into your Linux systems.
Remember to practice these commands in a safe environment and always consider the performance impact when running intensive queries on production systems. The journal’s binary format and indexing make it highly efficient, but proper filtering is still essential for optimal performance.
Related Posts
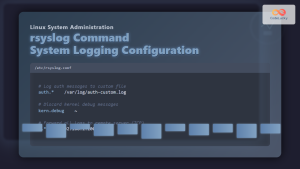
rsyslog Command Linux: System Logging Configuration with Examples
rsyslog is one of the most powerful and widely used system logging tools in Linux. It stands for “rocket-fast syslog”...
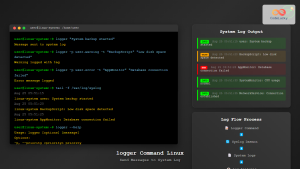
logger Command Linux: Complete Guide to System Log Message Management
The logger command in Linux is a powerful utility that allows users and scripts to send messages directly to the...
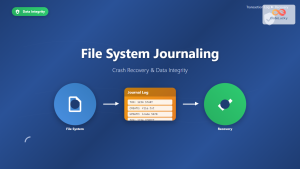
File System Journaling: Complete Guide to Crash Recovery and Data Integrity
Understanding File System Journaling File system journaling is a critical mechanism that ensures data integrity and enables rapid crash recovery...
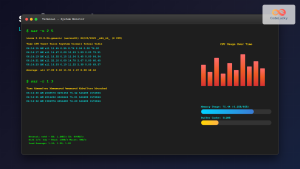
sar Command Linux: System Activity Reporter for Performance Monitoring
The sar (System Activity Reporter) command is one of the most powerful and comprehensive system monitoring tools available in Linux....
MySQL Logging: Monitoring Activity and Troubleshooting Issues
MySQL logging is crucial for understanding your database's behavior, tracking changes, and diagnosing problems. Without proper logging, you're essentially flying...
systemctl Command Linux: Complete Guide to Control Systemd Services
The systemctl command is the primary tool for controlling systemd services in modern Linux distributions. As the central management utility...
auditbeat Linux: Complete Guide to Shipping Audit Data to Elasticsearch
Introduction to auditbeat auditbeat is a lightweight shipper from the Elastic Beat family that collects audit data from the Linux...

systemd Linux: Complete Guide to System and Service Manager
systemd is a powerful system and service manager that has become the default init system for most modern Linux distributions....
loginctl Command Linux: Master Session Management with Practical Examples
The loginctl command is a powerful systemd utility that allows system administrators to introspect and control the systemd login manager...
last Command Linux: Display Login History and System Boot Records
The last command is an essential Linux utility that displays a chronological list of user logins, system boots, and shutdowns...
strace Advanced Linux: Complete Guide to System Call Tracing and Debugging
strace is one of the most powerful debugging and diagnostic tools available in Linux systems. It allows you to trace...
ltrace Command Linux: Complete Guide to Trace Library Calls and Debug Programs
The ltrace command is a powerful debugging and analysis tool in Linux that allows you to trace library calls made...