
The jnettop command is a powerful Linux network monitoring tool that provides real-time visibility into network traffic organized by individual connections. Unlike traditional network monitoring tools that show aggregate statistics, jnettop displays detailed information about each active network connection, making it invaluable for system administrators and network professionals who need granular network analysis.
What is jnettop?
jnettop (Just Network Top) is a network traffic analyzer that captures and displays network connections in real-time, similar to how the top command shows running processes. It presents network activity in an intuitive, sortable format that allows you to identify which connections are consuming the most bandwidth, monitor connection states, and troubleshoot network issues effectively.
Key Features of jnettop
- Real-time monitoring: Live updates of network connections and their bandwidth usage
- Connection-based view: Shows individual TCP and UDP connections rather than just interface statistics
- Sortable columns: Sort by various metrics like bandwidth, packets, or connection state
- Protocol filtering: Focus on specific protocols or connection types
- Interactive interface: Navigate and filter connections using keyboard shortcuts
- Minimal resource usage: Lightweight tool that doesn’t significantly impact system performance
Installation
Ubuntu/Debian Systems
sudo apt update
sudo apt install jnettop
CentOS/RHEL/Fedora Systems
# For RHEL/CentOS with EPEL repository
sudo yum install epel-release
sudo yum install jnettop

# For Fedora
sudo dnf install jnettop
Arch Linux
sudo pacman -S jnettopVerifying Installation
jnettop --versionExpected output:
jnettop version 0.13.0Basic Usage and Syntax
The basic syntax for jnettop is:
jnettop [options] [filter_expression]Starting jnettop with Default Settings
sudo jnettopNote: jnettop requires root privileges to capture network packets. When you run this command, you’ll see a display similar to:
   jnettop, version 0.13.0                    RX: 2.1KB/s  TX: 4.3KB/s  TOTAL: 6.4KB/s

Source                 Dest                   Proto  Local Port  Remote Port   RX Rate   TX Rate
192.168.1.105:22       192.168.1.100:54321    tcp    22          54321         1.2KB/s   0.8KB/s
192.168.1.105:80       192.168.1.150:45678    tcp    80          45678         0.3KB/s   2.1KB/s
192.168.1.105:443      203.0.113.25:12345     tcp    443         12345         0.6KB/s   1.4KB/s
Command Line Options
Interface Selection
Monitor a specific network interface:
sudo jnettop -i eth0List available interfaces:
sudo jnettop -i any --list-interfacesDisplay Options
Set custom display refresh interval (in seconds):
sudo jnettop -d 2Display only TCP connections:
sudo jnettop --display tcpDisplay only UDP connections:
sudo jnettop --display udpFiltering Options
Monitor specific port:
sudo jnettop port 80Monitor specific host:
sudo jnettop host 192.168.1.100Monitor specific network:
sudo jnettop net 192.168.1.0/24Interactive Commands
Once jnettop is running, you can use these keyboard shortcuts to control the display:
| Key | Action |
|---|---|
s |
Sort by source address |
d |
Sort by destination address |
r |
Sort by RX (received) rate |
t |
Sort by TX (transmitted) rate |
b |
Sort by total bandwidth (RX + TX) |
p |
Sort by protocol |
n |
Toggle name resolution |
q |
Quit jnettop |
j/k |
Navigate up/down through connections |
Practical Examples
Example 1: Monitoring Web Server Traffic
To monitor HTTP and HTTPS traffic on a web server:
sudo jnettop port 80 or port 443Sample output:
   jnettop, version 0.13.0                    RX: 15.2KB/s  TX: 42.8KB/s  TOTAL: 58.0KB/s

Source                 Dest                   Proto  Local Port  Remote Port   RX Rate   TX Rate
10.0.1.50:80          203.0.113.45:34567     tcp    80          34567         2.1KB/s   8.4KB/s
10.0.1.50:443         198.51.100.23:45678    tcp    443         45678         5.2KB/s   12.1KB/s
10.0.1.50:80          192.0.2.15:56789       tcp    80          56789         1.8KB/s   6.2KB/s
10.0.1.50:443         203.0.113.78:23456     tcp    443         23456         6.1KB/s   16.1KB/s
Example 2: Monitoring SSH Connections
To specifically monitor SSH traffic:
sudo jnettop port 22Sample output:
   jnettop, version 0.13.0                    RX: 3.2KB/s   TX: 1.8KB/s   TOTAL: 5.0KB/s

Source                 Dest                   Proto  Local Port  Remote Port   RX Rate   TX Rate
192.168.1.10:22       192.168.1.100:54234    tcp    22          54234         1.1KB/s   0.8KB/s
192.168.1.10:22       10.0.0.25:43210        tcp    22          43210         2.1KB/s   1.0KB/s
Example 3: Monitoring Specific Host Communication
To monitor all traffic to/from a specific host:
sudo jnettop host 192.168.1.100Sample output:
   jnettop, version 0.13.0                    RX: 8.7KB/s   TX: 12.3KB/s  TOTAL: 21.0KB/s

Source                 Dest                   Proto  Local Port  Remote Port   RX Rate   TX Rate
192.168.1.10:22       192.168.1.100:54234    tcp    22          54234         1.1KB/s   0.8KB/s
192.168.1.100:80      192.168.1.10:45678     tcp    80          45678         3.2KB/s   5.4KB/s
192.168.1.100:443     192.168.1.10:56789     tcp    443         56789         4.4KB/s   6.1KB/s
Advanced Usage Scenarios
Network Troubleshooting
When experiencing network performance issues, jnettop helps identify problematic connections:
sudo jnettop -d 1This runs jnettop with 1-second refresh intervals, allowing you to quickly spot connections consuming excessive bandwidth or showing unusual patterns.
Security Monitoring
Monitor for suspicious outbound connections:
sudo jnettop not port 80 and not port 443 and not port 22This command filters out common legitimate traffic, helping you spot potentially malicious connections.
Database Connection Monitoring
Monitor database connections (MySQL example):
sudo jnettop port 3306Sample output showing database connections:
   jnettop, version 0.13.0                    RX: 25.4KB/s  TX: 18.7KB/s  TOTAL: 44.1KB/s

Source                 Dest                   Proto  Local Port  Remote Port   RX Rate   TX Rate
10.0.1.20:3306        10.0.1.15:34567        tcp    3306        34567         8.2KB/s   5.4KB/s
10.0.1.20:3306        10.0.1.25:45678        tcp    3306        45678         12.1KB/s  7.8KB/s
10.0.1.20:3306        10.0.1.30:56789        tcp    3306        56789         5.1KB/s   5.5KB/s
Understanding the Output
Column Descriptions
- Source: Source IP address and port number
- Dest: Destination IP address and port number
- Proto: Protocol (TCP or UDP)
- Local Port: Local port number for the connection
- Remote Port: Remote port number for the connection
- RX Rate: Rate of data received (incoming traffic)
- TX Rate: Rate of data transmitted (outgoing traffic)
Header Information
The header displays:
- RX: Total receive rate across all connections
- TX: Total transmit rate across all connections
- TOTAL: Combined RX and TX rates
Comparison with Other Network Tools
jnettop vs netstat
While netstat shows static connection information, jnettop provides real-time bandwidth usage per connection:
# netstat shows connection state but no bandwidth
netstat -tuln

# jnettop shows real-time bandwidth per connection
sudo jnettop
jnettop vs iftop
iftop shows traffic between hosts, while jnettop shows individual connections:
# iftop shows host-to-host traffic
sudo iftop -i eth0

# jnettop shows connection-level detail
sudo jnettop -i eth0
Common Use Cases
1. Application Performance Monitoring
Monitor how much bandwidth specific applications consume by filtering their ports:
sudo jnettop port 80802. Network Capacity Planning
Identify peak usage patterns and connection distributions:
sudo jnettop -d 53. Incident Response
Quickly identify high-bandwidth connections during network issues:
sudo jnettop | head -20Tips and Best Practices
Performance Considerations
- Use appropriate refresh intervals: Lower refresh rates (higher -d values) reduce system load
- Filter traffic when possible: Use filters to reduce the amount of data processed
- Monitor specific interfaces: Use -i option to focus on relevant network interfaces
Security Considerations
- Run with minimal privileges: While root is required for packet capture, consider running in restricted environments
- Be aware of sensitive data: jnettop displays network connections that might reveal sensitive information
- Use filtering: Apply filters to focus on relevant traffic and avoid capturing unnecessary data
Troubleshooting Common Issues
Permission Denied
If you encounter permission errors:
# Ensure you're running as root or with sudo
sudo jnettop

# Check if your user is in the appropriate groups
groups $USER
No Traffic Displayed
If jnettop shows no connections:
- Verify the correct network interface:
ip link show - Check if there’s actual network activity:
ping google.com - Ensure proper filters aren’t excluding all traffic
High CPU Usage
If jnettop consumes too much CPU:
- Increase refresh interval:
sudo jnettop -d 10 - Apply more restrictive filters to reduce processed traffic
- Consider using other tools for long-term monitoring
Conclusion
The jnettop command is an invaluable tool for Linux system administrators and network professionals who need detailed, real-time visibility into network connections. Its ability to display individual connection bandwidth usage makes it particularly useful for troubleshooting network performance issues, monitoring application behavior, and conducting security analysis.
Whether you’re managing a web server, diagnosing network problems, or simply wanting to understand your system’s network activity, jnettop provides the granular connection-level detail that other network monitoring tools often lack. By mastering its various options and interactive features, you can significantly enhance your network monitoring and troubleshooting capabilities.
Remember to use jnettop responsibly, especially in production environments, and always consider the performance impact of real-time network monitoring on your systems. With proper usage and understanding, jnettop becomes a powerful addition to your Linux networking toolkit.
Related Posts
iftop Command Linux: Monitor Network Traffic and Display Bandwidth Usage by Connection
The iftop command is a powerful network monitoring tool in Linux that displays real-time bandwidth usage by network connections. Similar...
nethogs Command Linux: Monitor Real-Time Network Usage by Process
Network monitoring is a crucial aspect of system administration, especially when you need to identify which processes are consuming bandwidth...
nethogs Advanced Linux: Complete Guide to Per-Process Network Monitoring
Network monitoring is crucial for system administrators and developers who need to track bandwidth usage and identify network-intensive processes. While...
netstat Command Linux: Complete Guide to Network Connection Monitoring
The netstat command is one of the most essential network monitoring tools in Linux systems. It provides comprehensive information about...

iptraf Command Linux: Complete Interactive Network Monitoring Guide
The iptraf command is a powerful console-based network monitoring utility for Linux systems that provides real-time IP LAN monitoring capabilities....
ntopng Command Linux: Complete Guide to Web-Based Network Traffic Monitoring
Network traffic monitoring is crucial for maintaining optimal network performance, security, and troubleshooting connectivity issues. The ntopng command provides a...
nload Command Linux: Complete Guide to Monitor Network Traffic and Bandwidth in Real-Time
The nload command is a powerful Linux utility that provides real-time monitoring of network traffic and bandwidth usage. Unlike basic...
Wireshark Command Linux: Complete Network Protocol Analyzer Guide
Wireshark is the world's most popular network protocol analyzer, providing deep visibility into network traffic and communication protocols. While most...
bmon Command Linux: Complete Guide to Real-Time Bandwidth Monitoring and Network Analysis
The bmon (Bandwidth Monitor) command is a powerful Linux utility designed for real-time network bandwidth monitoring and rate estimation. This...
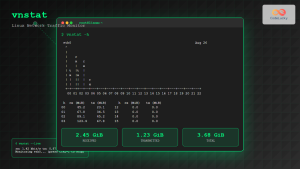
vnstat Command Linux: Complete Network Traffic Monitoring Guide
Network traffic monitoring is a crucial aspect of system administration, and the vnstat command in Linux provides an elegant solution...
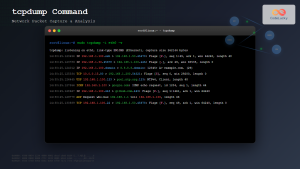
tcpdump Command Linux: Complete Guide to Network Packet Capture and Analysis
The tcpdump command is one of the most powerful network analysis tools available in Linux systems. It allows system administrators...

Paessler Linux: Complete Guide to Network Monitoring with PRTG on Linux Systems
Network monitoring is crucial for maintaining optimal performance and security in Linux environments. Paessler PRTG Network Monitor offers comprehensive monitoring...


