Java's automatic memory management is one of its most powerful features, freeing developers from the burden of manual memory allocation and deallocation. At the heart of this system lies the Garbage Collector (GC), a complex yet crucial component that ensures efficient memory utilization. In this comprehensive guide, we'll dive deep into Java's memory management, exploring the intricacies of garbage collection and how it impacts your applications.
The Java Memory Model
Before we delve into garbage collection, it's essential to understand Java's memory model. The Java Virtual Machine (JVM) divides memory into several areas:
- Heap: This is where all objects are allocated. It's the primary focus of garbage collection.
- Stack: Contains method-specific values and references.
- Method Area: Stores class structures, methods, and constant pools.
- Native Method Stack: Used for native method execution.
- PC Registers: Stores the current execution point for each thread.
🔍 The heap is further divided into:
- Young Generation (Eden Space and Survivor Spaces)
- Old Generation
- Permanent Generation (Metaspace in Java 8+)
The Garbage Collection Process
Garbage collection in Java is an automatic process that identifies and removes objects that are no longer needed by the application. Here's a simplified overview of how it works:
- Mark: The GC identifies which objects are in use and which are not.
- Sweep: Unused objects are removed.
- Compact: Remaining objects are compacted to free up contiguous memory.
Let's look at a simple example to illustrate this:
public class GCExample {
    public static void main(String[] args) {
        String str1 = new String("Hello");
        String str2 = new String("World");
        str1 = null;  // str1 is now eligible for garbage collection
        System.gc();  // Requesting garbage collection (not guaranteed)
    }
}
In this example, str1 becomes eligible for garbage collection when we set it to null. However, str2 remains in use and won't be collected.
Types of Garbage Collectors
Java offers several garbage collector implementations, each with its own strengths:
- Serial GC: Simple, single-threaded collector suitable for small applications.
- Parallel GC: Uses multiple threads for collection, good for multi-core systems.
- Concurrent Mark Sweep (CMS): Minimizes pause times by doing most work concurrently.
- G1 GC: Designed for large heaps, aims to balance throughput and latency.
- ZGC: Low-latency collector introduced in Java 11.
To specify a garbage collector, you can use JVM flags. For example:
java -XX:+UseParallelGC MyApplication
Generational Garbage Collection
Most modern garbage collectors in Java use a generational approach. This is based on the empirical observation that most objects die young. The heap is divided into:
- Young Generation: Where new objects are allocated.
- Old Generation: Where long-lived objects are moved.
Let's see how objects move through these generations:
public class GenerationalGCExample {
    public static void main(String[] args) {
        for (int i = 0; i < 1000000; i++) {
            Object obj = new Object();  // Objects created in Eden space
            if (i % 100000 == 0) {
                obj = null;  // Some objects become unreachable
            }
        }
    }
}
In this example:
- Most objects are created in the Eden space of the Young Generation.
- Objects that survive multiple young generation collections are promoted to the Old Generation.
- Objects set to
nullbecome eligible for collection in their respective generations.
Monitoring Garbage Collection
Understanding GC behavior is crucial for optimizing Java applications. Java provides tools for monitoring GC activity:
- Verbose GC: Enable with
-verbose:gcJVM flag. - JConsole: A graphical monitoring tool included with the JDK.
- VisualVM: A visual tool for monitoring JVM performance.
Here's an example of using Verbose GC:
public class GCMonitoringExample {
    public static void main(String[] args) {
        for (int i = 0; i < 1000000; i++) {
            new Object();
        }
    }
}
Run this with:
java -verbose:gc GCMonitoringExample
You'll see output similar to:
[GC (Allocation Failure) [PSYoungGen: 16384K->2528K(18944K)] 16384K->2536K(62976K), 0.0014119 secs] [Times: user=0.00 sys=0.00, real=0.00 secs]
[GC (Allocation Failure) [PSYoungGen: 18912K->2560K(18944K)] 18920K->2568K(62976K), 0.0013800 secs] [Times: user=0.00 sys=0.00, real=0.00 secs]
...
This output shows when GC occurs, how much memory was reclaimed, and how long it took.
Fine-tuning Garbage Collection
While Java's automatic memory management is powerful, sometimes you need to fine-tune it for optimal performance. Here are some key JVM flags:
-Xms: Sets the initial heap size-Xmx: Sets the maximum heap size-XX:NewRatio: Sets the ratio of Old/Young Generation sizes-XX:SurvivorRatio: Sets the ratio of Eden/Survivor space sizes
Example:
java -Xms512m -Xmx1024m -XX:NewRatio=3 MyApplication
This sets an initial heap of 512MB, a max of 1GB, and a 3:1 ratio of Old to Young Generation.
Best Practices for Efficient Memory Management
- Avoid Explicit GC Calls: Using
System.gc()can be inefficient and unpredictable. - Use Appropriate Collection Types: Choose the right data structures to avoid unnecessary object creation.
- Implement Object Pooling: For frequently used, expensive-to-create objects.
- Avoid Memory Leaks: Be cautious with static fields and inner classes.
Here's an example of object pooling:
import java.util.concurrent.ConcurrentLinkedQueue;

public class ObjectPool<T> {
    private ConcurrentLinkedQueue<T> pool;
    private ObjectFactory<T> factory;

    public ObjectPool(ObjectFactory<T> factory) {
        this.factory = factory;
        this.pool = new ConcurrentLinkedQueue<>();
    }

    public T borrowObject() {
        T object = pool.poll();
        if (object == null) {
            object = factory.createObject();
        }
        return object;
    }

    public void returnObject(T object) {
        pool.offer(object);
    }

    public interface ObjectFactory<T> {
        T createObject();
    }
}

// Usage
ObjectPool<StringBuilder> pool = new ObjectPool<>(() -> new StringBuilder());
StringBuilder sb = pool.borrowObject();
// Use sb...
pool.returnObject(sb);
This object pool helps reduce the frequency of object creation and garbage collection for frequently used objects.
Common Garbage Collection Issues and Solutions
-
Issue: Frequent Full GC pauses
Solution: Increase heap size or tune generation sizes -
Issue: OutOfMemoryError
Solution: Identify memory leaks, increase heap size, or optimize object creation -
Issue: Long GC pauses
Solution: Consider using CMS or G1 collector, or upgrade to ZGC for very large heaps
Here's an example of how to diagnose a memory leak:
import java.util.ArrayList;
import java.util.List;

public class MemoryLeakExample {
    private static List<byte[]> leakyList = new ArrayList<>();

    public static void main(String[] args) {
        while (true) {
            byte[] leakyArray = new byte[1024 * 1024];  // 1MB
            leakyList.add(leakyArray);
            System.out.println("Added 1MB. Total: " + leakyList.size() + "MB");
            try {
                Thread.sleep(1000);
            } catch (InterruptedException e) {
                e.printStackTrace();
            }
        }
    }
}
Run this with:
java -Xmx256m -verbose:gc MemoryLeakExample
You'll see the heap fill up and eventually throw an OutOfMemoryError. This demonstrates how memory leaks can occur and how to identify them using GC logs.
Advanced Garbage Collection Techniques
Weak References
Weak references allow you to refer to an object without preventing garbage collection. They're useful for implementing caches:
import java.lang.ref.WeakReference;
import java.util.WeakHashMap;

public class WeakReferenceExample {
    public static void main(String[] args) {
        WeakReference<String> weakRef = new WeakReference<>(new String("Hello"));
        System.out.println(weakRef.get());  // Prints "Hello"

        System.gc();  // Trigger garbage collection

        System.out.println(weakRef.get());  // May print null if GC occurred

        // WeakHashMap example
        WeakHashMap<String, Integer> weakMap = new WeakHashMap<>();
        String key = new String("Key");
        weakMap.put(key, 1);
        System.out.println(weakMap.get(key));  // Prints 1

        key = null;  // Remove strong reference
        System.gc();  // Trigger garbage collection

        System.out.println(weakMap.size());  // May print 0 if GC occurred
    }
}
Phantom References
Phantom references are even weaker than weak references and are used for more fine-grained post-mortem cleanup:
import java.lang.ref.PhantomReference;
import java.lang.ref.ReferenceQueue;

public class PhantomReferenceExample {
    public static void main(String[] args) {
        ReferenceQueue<Object> queue = new ReferenceQueue<>();
        Object obj = new Object();
        PhantomReference<Object> phantomRef = new PhantomReference<>(obj, queue);

        obj = null;  // Remove strong reference
        System.gc();  // Trigger garbage collection

        try {
            // This will block until the reference is enqueued
            queue.remove();
            System.out.println("Object has been finalized");
        } catch (InterruptedException e) {
            e.printStackTrace();
        }
    }
}
Conclusion
Java's garbage collection mechanism is a powerful tool that simplifies memory management for developers. By understanding how it works and how to fine-tune it, you can create more efficient and robust Java applications. Remember that while garbage collection is automatic, being aware of its workings allows you to write code that cooperates with the GC rather than fighting against it.
As you continue to develop in Java, keep these principles in mind:
- Design your objects with their lifecycle in mind.
- Use appropriate data structures and collection types.
- Monitor your application's memory usage and GC behavior.
- Fine-tune GC parameters when necessary, but always benchmark to confirm improvements.
By mastering Java's memory management and garbage collection, you'll be well-equipped to create high-performance, scalable Java applications that efficiently utilize system resources. Happy coding! 🚀
Related Posts
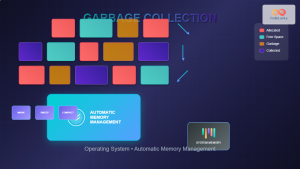
Garbage Collection in Operating System: Complete Guide to Automatic Memory Management
What is Garbage Collection in Operating Systems? Garbage collection is an automatic memory management technique used by operating systems and...

Java Performance Tuning: Optimization Techniques
Java, known for its "write once, run anywhere" philosophy, has been a cornerstone of enterprise application development for decades. However,...
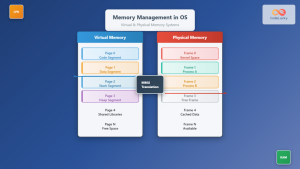
Memory Management in Operating System: Virtual and Physical Memory Fundamentals
Introduction to Memory Management Memory management is one of the most critical functions of an operating system, responsible for efficiently...

Java JVM: Java Virtual Machine Basics
Java's "Write Once, Run Anywhere" philosophy is made possible by the Java Virtual Machine (JVM). This powerful component of the...

Java Thread Pool: Efficient Thread Management
In the world of Java programming, efficient thread management is crucial for developing high-performance applications. One of the most powerful...

Memory Allocation Techniques: Contiguous vs Non-contiguous Management Strategies
Memory allocation is a fundamental aspect of operating system design that determines how programs and data are stored and accessed...
Java Delete Files: Removing Files from System
Java provides robust file handling capabilities, including the ability to delete files from the system. Whether you're cleaning up temporary...

Windows Memory Management: Virtual Memory Implementation and Optimization Guide
Introduction to Windows Virtual Memory Windows virtual memory is a sophisticated memory management system that allows programs to use more...

Java Data Types: Primitives and Reference Types
Java, as a strongly-typed programming language, offers a robust system of data types that form the foundation of its type...

Java Threads: Basics of Multithreading
In the world of modern computing, multithreading has become an essential concept for developers to grasp. Java, being one of...
Virtual Memory in Virtualization: Memory Overcommitment Strategies and Implementation
Introduction to Memory Overcommitment Memory overcommitment is a fundamental virtualization technique that allows hypervisors to allocate more virtual memory to...

Java ArrayList Methods: Operations on Dynamic Arrays
Java's ArrayList is a powerful and flexible data structure that provides dynamic array functionality. It's part of the Java Collections...
- The Java Memory Model
- The Garbage Collection Process
- Types of Garbage Collectors
- Generational Garbage Collection
- Monitoring Garbage Collection
- Fine-tuning Garbage Collection
- Best Practices for Efficient Memory Management
- Common Garbage Collection Issues and Solutions
- Advanced Garbage Collection Techniques
- Conclusion