Java's "Write Once, Run Anywhere" philosophy is made possible by the Java Virtual Machine (JVM). This powerful component of the Java ecosystem is the cornerstone of Java's platform independence and is crucial for every Java developer to understand. In this comprehensive guide, we'll dive deep into the JVM, exploring its architecture, functionality, and the pivotal role it plays in executing Java applications.
What is the Java Virtual Machine?
The Java Virtual Machine (JVM) is an abstract computing machine that provides a runtime environment in which Java bytecode can be executed. It's the foundation of the Java platform and is responsible for Java's hardware and operating system independence.
🔑 Key Point: The JVM acts as a bridge between your Java code and the underlying hardware, allowing Java programs to run on any device or operating system that has a JVM installed.
The JVM Architecture
Understanding the JVM architecture is crucial for optimizing Java applications and troubleshooting performance issues. Let's break down the main components:
1. Class Loader Subsystem
The Class Loader Subsystem is responsible for loading, linking, and initializing Java classes and interfaces.
public class ClassLoaderExample {
    public static void main(String[] args) {
        // Get the class loader of the current class
        ClassLoader classLoader = ClassLoaderExample.class.getClassLoader();

        System.out.println("Class Loader of ClassLoaderExample: " + classLoader);
        System.out.println("Parent ClassLoader: " + classLoader.getParent());
        System.out.println("Grandparent ClassLoader: " + classLoader.getParent().getParent());
    }
}
Output:
Class Loader of ClassLoaderExample: sun.misc.Launcher$AppClassLoader@18b4aac2
Parent ClassLoader: sun.misc.Launcher$ExtClassLoader@1b6d3586
Grandparent ClassLoader: null
This example demonstrates the hierarchical nature of class loaders in Java. The null output for the grandparent class loader represents the bootstrap class loader, which is implemented natively and has no Java representation.
2. Runtime Data Areas
The JVM defines various runtime data areas that are used during execution of a program:
2.1 Method Area
The method area stores class structures, method data, and constant runtime pool.
2.2 Heap
The heap is the runtime data area from which memory for all class instances and arrays is allocated.
public class HeapExample {
    public static void main(String[] args) {
        // Get the maximum heap size
        long maxHeapSize = Runtime.getRuntime().maxMemory();

        // Get the total heap size
        long totalHeapSize = Runtime.getRuntime().totalMemory();

        // Get the free heap size
        long freeHeapSize = Runtime.getRuntime().freeMemory();

        System.out.println("Max Heap Size: " + maxHeapSize / (1024 * 1024) + " MB");
        System.out.println("Total Heap Size: " + totalHeapSize / (1024 * 1024) + " MB");
        System.out.println("Free Heap Size: " + freeHeapSize / (1024 * 1024) + " MB");
    }
}
Output (may vary based on your system):
Max Heap Size: 910 MB
Total Heap Size: 123 MB
Free Heap Size: 121 MB
This example shows how to query information about the JVM's heap memory.
2.3 Stack
The Java stack stores frames. It holds local variables and partial results, and plays a part in method invocation and return.
public class StackExample {
    public static void main(String[] args) {
        method1();
    }

    public static void method1() {
        method2();
    }

    public static void method2() {
        method3();
    }

    public static void method3() {
        Thread.dumpStack();
    }
}
Output:
java.lang.Exception: Stack trace
    at java.lang.Thread.dumpStack(Thread.java:1336)
    at StackExample.method3(StackExample.java:14)
    at StackExample.method2(StackExample.java:10)
    at StackExample.method1(StackExample.java:6)
    at StackExample.main(StackExample.java:2)
This example demonstrates the stack trace, showing the method call hierarchy.
2.4 Program Counter Register
The PC Register contains the address of the Java virtual machine instruction currently being executed.
2.5 Native Method Stack
The Native Method Stack contains all the native methods used in the application.
3. Execution Engine
The Execution Engine executes the bytecode assigned to the runtime data area. It reads the bytecode stream then executes the instructions.
🔍 Fun Fact: The JVM's Just-In-Time (JIT) compiler, part of the Execution Engine, can significantly improve performance by compiling frequently executed bytecode to native machine code at runtime.
JVM in Action: A Practical Example
Let's look at a complete example that demonstrates various aspects of JVM operation:
public class JVMDemo {
    private static final int MEGABYTE = 1024 * 1024;

    public static void main(String[] args) {
        // Demonstrate class loading
        System.out.println("Class loader of JVMDemo: " + JVMDemo.class.getClassLoader());

        // Demonstrate heap memory usage
        Runtime runtime = Runtime.getRuntime();
        System.out.println("Max memory: " + runtime.maxMemory() / MEGABYTE + "MB");
        System.out.println("Total memory: " + runtime.totalMemory() / MEGABYTE + "MB");
        System.out.println("Free memory: " + runtime.freeMemory() / MEGABYTE + "MB");
        System.out.println("Used memory: " + (runtime.totalMemory() - runtime.freeMemory()) / MEGABYTE + "MB");

        // Demonstrate stack trace
        method1();

        // Demonstrate garbage collection
        System.out.println("\nCalling System.gc()");
        System.gc();
        System.out.println("Free memory after gc: " + runtime.freeMemory() / MEGABYTE + "MB");
    }

    public static void method1() {
        method2();
    }

    public static void method2() {
        System.out.println("\nCurrent stack trace:");
        for (StackTraceElement element : Thread.currentThread().getStackTrace()) {
            System.out.println(element);
        }
    }
}
Output:
Class loader of JVMDemo: sun.misc.Launcher$AppClassLoader@18b4aac2
Max memory: 910MB
Total memory: 123MB
Free memory: 121MB
Used memory: 2MB

Current stack trace:
java.lang.Thread.getStackTrace(Thread.java:1559)
JVMDemo.method2(JVMDemo.java:28)
JVMDemo.method1(JVMDemo.java:23)
JVMDemo.main(JVMDemo.java:19)

Calling System.gc()
Free memory after gc: 121MB
This comprehensive example demonstrates:
- Class loading
- Heap memory usage
- Stack trace
- Garbage collection
JVM Tuning and Optimization
Understanding the JVM is crucial for optimizing Java applications. Here are some key areas to focus on:
1. Garbage Collection
The JVM's garbage collector automatically manages memory, but you can tune it for better performance:
public class GCExample {
    public static void main(String[] args) {
        System.out.println("Starting GC example");

        // Create a large number of objects
        for (int i = 0; i < 1000000; i++) {
            new Object();
        }

        System.out.println("Created 1,000,000 objects");

        // Request garbage collection
        System.gc();

        System.out.println("Garbage collection requested");
    }
}
To run this with verbose GC logging:
java -verbose:gc GCExample
This will print detailed information about garbage collection events.
2. JVM Flags
JVM flags allow you to configure various aspects of the JVM:
java -Xmx512m -Xms256m MyJavaApp
This sets the maximum heap size to 512MB and the initial heap size to 256MB.
3. JIT Compilation
The JIT compiler can be tuned for better performance:
java -XX:+PrintCompilation MyJavaApp
This flag prints JIT compilation events, helping you understand which methods are being compiled.
Conclusion
The Java Virtual Machine is a complex and powerful piece of software that forms the backbone of Java's platform independence. By understanding its architecture and operation, you can write more efficient Java code and better optimize your applications.
From class loading to memory management, from bytecode execution to JIT compilation, the JVM handles a multitude of tasks that allow Java developers to focus on writing great code without worrying about the underlying hardware.
As you continue your Java journey, keep the JVM in mind. Its capabilities and limitations shape the way we write Java code, and a deep understanding of the JVM can elevate your skills from a Java programmer to a true Java expert.
🚀 Pro Tip: Always profile your Java applications to understand how they interact with the JVM. Tools like VisualVM can provide invaluable insights into memory usage, CPU time, and garbage collection behavior.
Remember, the JVM is not just a black box that runs your code – it's a sophisticated piece of engineering that you can leverage to create faster, more efficient Java applications. Happy coding!
Related Posts

Java Hello World: Your First Java Program
Welcome to the exciting world of Java programming! 🚀 In this comprehensive guide, we'll walk you through creating your very...
java Command Linux: Complete Guide to Running Java Applications and Programs
The java command is one of the most essential tools for developers working with Java applications on Linux systems. This...

Java Environment Setup: Installation and Configuration
Java, one of the world's most popular programming languages, powers countless applications across various platforms. Whether you're a budding developer...
javac Command Linux: Complete Guide to Compiling Java Source Files
The javac command is the Java compiler that transforms Java source code (.java files) into bytecode (.class files) that can...

Java 9 Features: Modules and API Improvements
Java 9, released in September 2017, brought significant enhancements to the Java platform. This version introduced a modular system and...
Java Threads: Basics of Multithreading
In the world of modern computing, multithreading has become an essential concept for developers to grasp. Java, being one of...
Java Memory Management: Understanding Garbage Collection
Java's automatic memory management is one of its most powerful features, freeing developers from the burden of manual memory allocation...
Java Thread Lifecycle: States and Transitions
Java's multithreading capabilities are a cornerstone of its power and flexibility. At the heart of this system lies the Java...
Java JavaBeans: Reusable Software Components
Java JavaBeans are a powerful and versatile feature of the Java programming language, designed to create reusable software components. These...

Java Security: Basic Concepts and Implementation
Java, renowned for its "write once, run anywhere" philosophy, has always placed a strong emphasis on security. In today's digital...
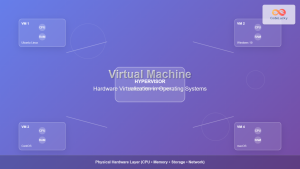
Virtual Machine in Operating System: Complete Guide to Hardware Virtualization Technology
What is a Virtual Machine in Operating System? A Virtual Machine (VM) is a software-based emulation of a physical computer...
Java Networking: Socket Programming
Java's robust networking capabilities make it an excellent choice for developing distributed applications. At the heart of Java's networking prowess...