
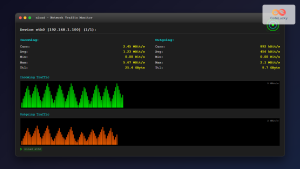
The iptraf command is a powerful console-based network monitoring utility for Linux systems that provides real-time IP LAN monitoring capabilities. This interactive tool displays detailed statistics about network traffic, helping system administrators and network engineers analyze bandwidth usage, connection states, and protocol distributions across their networks.
What is iptraf?
iptraf (IP Traffic Monitor) is a text-based network statistics utility that monitors various network interfaces and provides comprehensive traffic analysis. Unlike simple command-line tools that show static information, iptraf offers an interactive, menu-driven interface with real-time updates, making it an essential tool for network troubleshooting and performance monitoring.
Key Features of iptraf
- Real-time traffic monitoring – Live updates of network statistics
- Multiple interface support – Monitor all network interfaces simultaneously
- Protocol analysis – Detailed breakdown of TCP, UDP, ICMP, and other protocols
- Connection tracking – Monitor active TCP connections and their states
- Statistical reporting – Generate detailed network usage reports
- Filtering capabilities – Focus on specific hosts, ports, or protocols
- Logging functionality – Save monitoring data for later analysis
Installing iptraf on Linux
The installation process varies depending on your Linux distribution. Here are the commands for popular distributions:
Ubuntu/Debian Systems
sudo apt update
sudo apt install iptraf-ng
CentOS/RHEL/Fedora Systems
# For CentOS/RHEL 7/8
sudo yum install iptraf-ng

# For Fedora
sudo dnf install iptraf-ng
Arch Linux
sudo pacman -S iptraf-ngNote: Most modern distributions include iptraf-ng (next generation) instead of the original iptraf. The ng version includes bug fixes and additional features while maintaining backward compatibility.
Basic iptraf Command Syntax
The basic syntax for iptraf follows this pattern:
iptraf [options] [interface]Common Command Line Options
| Option | Description |
|---|---|
-i interface |
Monitor specific network interface |
-d interface |
Detailed interface statistics |
-s interface |
TCP/UDP service statistics |
-z interface |
Packet size breakdown |
-l interface |
LAN station statistics |
-g |
General interface statistics |
-t timeout |
Set monitoring duration in minutes |
-B |
Run in background mode |
-L logfile |
Specify log file location |
Interactive iptraf Interface
When you run iptraf without parameters, it launches the interactive menu-driven interface:
sudo iptrafThe main menu provides several monitoring options:
┌─────────────────────────────────────────────────┐
│                IPTraf Main Menu                  │
├─────────────────────────────────────────────────┤
│                                                 │
│    IP traffic monitor                           │
│    General interface statistics                 │
│    Detailed interface statistics                │
│    Statistical breakdowns...                    │
│    LAN station monitor                          │
│    Filters...                                   │
│    Configure...                                 │
│    Exit                                         │
│                                                 │
└─────────────────────────────────────────────────┘
Navigation Keys
- Arrow keys: Navigate through menu options
- Enter: Select menu item
- Tab: Switch between windows in monitoring modes
- X: Exit current screen or quit iptraf
- S: Sort data in various monitoring modes
- F: Access filter options
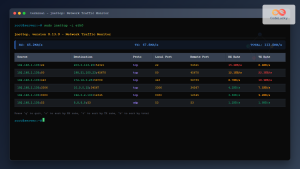
Monitoring IP Traffic
The IP traffic monitor is iptraf’s most popular feature, providing real-time information about active connections.
Starting IP Traffic Monitor
# Monitor all interfaces
sudo iptraf -i all

# Monitor specific interface
sudo iptraf -i eth0
The IP traffic monitor displays active TCP connections with detailed information:
TCP Connections (Source Host:Port → Destination Host:Port)
─────────────────────────────────────────────────────────
192.168.1.100:22 → 192.168.1.50:54321    ESTABLISHED
    Packets: 1,234    Bytes: 98,765
    Flags: [PSH,ACK]  Window: 4096

10.0.0.15:80 → 192.168.1.100:45678      ESTABLISHED
    Packets: 2,567    Bytes: 1,234,567
    Flags: [ACK]      Window: 8192

UDP Traffic Summary
───────────────────
Source → Destination          Packets    Bytes
192.168.1.1:53 → 192.168.1.100:34567    45        2,890
192.168.1.100:68 → 192.168.1.1:67       12        4,560
Understanding the Traffic Display
- Connection State: Shows TCP connection status (ESTABLISHED, SYN_SENT, etc.)
- Packet Count: Number of packets transmitted
- Byte Count: Total bytes transferred
- TCP Flags: Current TCP flags (ACK, PSH, SYN, FIN, RST)
- Window Size: TCP window size for flow control
Interface Statistics Monitoring
iptraf provides comprehensive interface statistics for monitoring network performance.
General Interface Statistics
# View general stats for all interfaces
sudo iptraf -g
This displays summary statistics for all network interfaces:
Interface Statistics Monitor
────────────────────────────────────────────────
Interface: eth0 (Ethernet)
    Total packets: 45,678
    Total bytes: 23,456,789
    Incoming packets: 22,839 (50.0%)
    Outgoing packets: 22,839 (50.0%)
    Incoming bytes: 11,728,394 (50.0%)
    Outgoing bytes: 11,728,395 (50.0%)
    Total errors: 0
    Total drops: 0

Interface: lo (Loopback)
    Total packets: 1,234
    Total bytes: 567,890
    Incoming packets: 617 (50.0%)
    Outgoing packets: 617 (50.0%)
Detailed Interface Statistics
# Detailed stats for specific interface
sudo iptraf -d eth0
Provides in-depth protocol breakdown:
Detailed Interface Statistics for eth0
───────────────────────────────────────────────
Protocol Breakdown:
    TCP: 15,678 packets (34.3%) - 8,901,234 bytes
    UDP: 8,901 packets (19.5%) - 4,567,890 bytes
    ICMP: 234 packets (0.5%) - 23,456 bytes
    Other IP: 567 packets (1.2%) - 234,567 bytes
    Non-IP: 20,298 packets (44.5%) - 9,729,642 bytes

Packet Size Distribution:
    64 bytes: 12,345 packets (27.0%)
    65-127 bytes: 8,901 packets (19.5%)
    128-255 bytes: 6,789 packets (14.9%)
    256-511 bytes: 4,567 packets (10.0%)
    512-1023 bytes: 3,456 packets (7.6%)
    1024-1518 bytes: 9,620 packets (21.0%)
LAN Station Monitoring
The LAN station monitor tracks traffic by MAC address, useful for monitoring individual devices on your network.
# Monitor LAN station activity
sudo iptraf -l eth0
Example output:
LAN Station Monitor (eth0)
──────────────────────────────────────────────────
MAC Address          IP Address      Pkts In  Pkts Out  Bytes In   Bytes Out
aa:bb:cc:dd:ee:ff   192.168.1.100    1,234    1,567     89,012     156,789
11:22:33:44:55:66   192.168.1.101      567      789     45,678      78,901
77:88:99:aa:bb:cc   192.168.1.102      890      456     67,890      34,567

Total Stations: 3
Total Traffic: 3,503 packets, 472,837 bytes
Protocol Statistics and Breakdowns
iptraf can provide detailed breakdowns of network protocols and services.
TCP/UDP Service Statistics
# Monitor service statistics
sudo iptraf -s eth0
Shows traffic breakdown by port/service:
TCP Service Statistics (eth0)
─────────────────────────────────────────
Port    Service    Connections  Packets    Bytes
22      SSH        3            1,234      89,012
80      HTTP       15           5,678      2,345,678
443     HTTPS      8            3,456      1,234,567
3306    MySQL      2            890        45,678

UDP Service Statistics (eth0)
─────────────────────────────────────────
Port    Service    Packets      Bytes
53      DNS        234          12,345
67      DHCP       45           5,678
68      DHCP       45           5,679
Packet Size Breakdown
# Analyze packet size distribution
sudo iptraf -z eth0
Advanced Filtering Options
iptraf supports powerful filtering capabilities to focus on specific traffic.
Creating Filters
Access filters through the interactive menu (Filters → Configure) or use command-line options:
# Example: Monitor only HTTP traffic
sudo iptraf -i eth0 -f tcp and port 80

# Monitor traffic from specific host
sudo iptraf -i eth0 -f host 192.168.1.100
Filter Examples
- TCP traffic only:
tcp - Specific port:
port 22 - Host-based filtering:
host 192.168.1.1 - Network range:
net 192.168.1.0/24 - Combined filters:
tcp and port 80 and host 192.168.1.100
Background Mode and Logging
iptraf can run in background mode for automated monitoring and logging.
Running in Background
# Run IP traffic monitor in background for 60 minutes
sudo iptraf -i eth0 -t 60 -B -L /var/log/iptraf.log
Log File Analysis
iptraf generates detailed logs that can be analyzed later:
# View log file
tail -f /var/log/iptraf.log

# Example log entry
Mon Aug 26 04:56:15 2025; iptraf 3.0.0 started
Mon Aug 26 04:56:15 2025; monitoring interface eth0
Mon Aug 26 04:56:16 2025; TCP; 192.168.1.100:22; 192.168.1.50:54321; 64 bytes
Mon Aug 26 04:56:17 2025; UDP; 192.168.1.1:53; 192.168.1.100:34567; 128 bytes
Configuration and Customization
iptraf allows extensive customization through its configuration menu.
Key Configuration Options
- Update interval: Set refresh rate (default: 1 second)
- Logging options: Configure automatic logging
- Display options: Customize information display
- Color settings: Adjust terminal colors
- Sound alerts: Enable audio notifications
Configuration File Location
# System-wide configuration
/etc/iptraf-ng/iptraf-ng.conf

# User-specific configuration
~/.iptraf-ng/iptraf-ng.conf
Practical Use Cases
Network Troubleshooting
Use iptraf to identify network issues:
# Monitor for connection problems
sudo iptraf -i eth0

# Look for:
# - High number of RST flags (connection resets)
# - Connections stuck in SYN_SENT state
# - Unusual traffic patterns
# - High error rates
Bandwidth Monitoring
# Track bandwidth usage over time
sudo iptraf -d eth0 -t 30 -L /tmp/bandwidth.log

# Analyze top talkers
sudo iptraf -l eth0
Security Monitoring
# Monitor for suspicious connections
sudo iptraf -i eth0

# Watch for:
# - Unexpected external connections
# - High-volume data transfers
# - Connections to unusual ports
# - Traffic from unknown hosts
Performance Tips and Best Practices
Optimization Guidelines
- Use specific interfaces: Monitor only necessary interfaces to reduce overhead
- Apply filters: Focus on relevant traffic to improve performance
- Adjust update intervals: Increase interval for high-traffic networks
- Use background mode: For long-term monitoring to avoid terminal session issues
- Regular log rotation: Prevent log files from consuming excessive disk space
System Resource Considerations
# Check iptraf resource usage
top -p $(pgrep iptraf)

# Limit monitoring duration for busy networks
sudo iptraf -i eth0 -t 15  # 15-minute sessions
Troubleshooting Common Issues
Permission Problems
iptraf requires root privileges for network interface access:
# Always run with sudo
sudo iptraf

# Or add user to appropriate group (distribution-specific)
sudo usermod -a -G wireshark $USER
Interface Detection Issues
# List available interfaces
ip link show

# Verify interface is active
ip addr show eth0

# Check if interface supports monitoring
sudo iptraf -i eth0
Display Problems
# Ensure terminal supports required features
echo $TERM

# Resize terminal for better display
resize

# Use alternative terminal if needed
TERM=xterm-256color iptraf
Alternatives to iptraf
While iptraf is powerful, consider these alternatives for specific needs:
- vnStat: Long-term bandwidth monitoring with database storage
- iftop: Real-time bandwidth usage by connection
- nethogs: Network usage by process
- tcpdump: Packet-level analysis and capture
- Wireshark: GUI-based comprehensive network analysis
Conclusion
The iptraf command is an indispensable tool for Linux system administrators and network engineers who need comprehensive, real-time network monitoring capabilities. Its interactive interface, combined with powerful filtering and logging features, makes it ideal for troubleshooting network issues, monitoring bandwidth usage, and maintaining network security.
Whether you’re diagnosing connectivity problems, tracking bandwidth consumption, or monitoring network security, iptraf provides the detailed insights needed for effective network management. By mastering its various modes and features, you can significantly improve your network monitoring and troubleshooting capabilities.
Remember to always run iptraf with appropriate privileges and consider the performance impact on busy networks. With proper configuration and regular use, iptraf becomes an essential component of your Linux network administration toolkit.
Related Posts
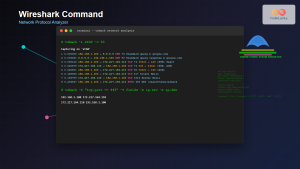
Wireshark Command Linux: Complete Network Protocol Analyzer Guide
Wireshark is the world's most popular network protocol analyzer, providing deep visibility into network traffic and communication protocols. While most...
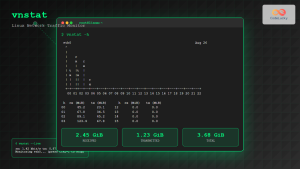
vnstat Command Linux: Complete Network Traffic Monitoring Guide
Network traffic monitoring is a crucial aspect of system administration, and the vnstat command in Linux provides an elegant solution...
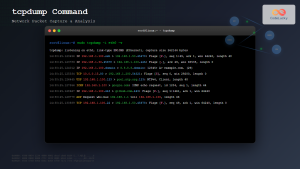
tcpdump Command Linux: Complete Guide to Network Packet Capture and Analysis
The tcpdump command is one of the most powerful network analysis tools available in Linux systems. It allows system administrators...
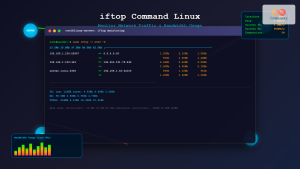
iftop Command Linux: Monitor Network Traffic and Display Bandwidth Usage by Connection
The iftop command is a powerful network monitoring tool in Linux that displays real-time bandwidth usage by network connections. Similar...
nethogs Command Linux: Monitor Real-Time Network Usage by Process
Network monitoring is a crucial aspect of system administration, especially when you need to identify which processes are consuming bandwidth...
netstat Command Linux: Complete Guide to Network Connection Monitoring
The netstat command is one of the most essential network monitoring tools in Linux systems. It provides comprehensive information about...
bmon Command Linux: Complete Guide to Real-Time Bandwidth Monitoring and Network Analysis
The bmon (Bandwidth Monitor) command is a powerful Linux utility designed for real-time network bandwidth monitoring and rate estimation. This...
jnettop Command Linux: Monitor Real-Time Network Traffic by Connection
The jnettop command is a powerful Linux network monitoring tool that provides real-time visibility into network traffic organized by individual...
nload Command Linux: Complete Guide to Monitor Network Traffic and Bandwidth in Real-Time
The nload command is a powerful Linux utility that provides real-time monitoring of network traffic and bandwidth usage. Unlike basic...
ip Command Linux: Complete Guide to Advanced Network Configuration and Management
The ip command is one of the most powerful and versatile networking tools in Linux, serving as the modern replacement...
Paessler Linux: Complete Guide to Network Monitoring with PRTG on Linux Systems
Network monitoring is crucial for maintaining optimal performance and security in Linux environments. Paessler PRTG Network Monitor offers comprehensive monitoring...
ntopng Command Linux: Complete Guide to Web-Based Network Traffic Monitoring
Network traffic monitoring is crucial for maintaining optimal network performance, security, and troubleshooting connectivity issues. The ntopng command provides a...


