
The iotop command is an essential Linux utility that provides real-time monitoring of disk I/O usage by processes and threads. Similar to how top monitors CPU usage, iotop displays which processes are causing the most disk activity on your system. This powerful tool is invaluable for system administrators and developers who need to identify I/O bottlenecks and optimize system performance.
What is iotop Command?
iotop is a Python-based utility that monitors I/O usage information provided by the Linux kernel and displays a table of current I/O usage by processes or threads on the system. It requires kernel 2.6.20 or later with the CONFIG_TASKSTATS and CONFIG_TASK_DELAY_ACCT options enabled.
Key Features of iotop:
- Real-time I/O monitoring
- Process and thread-level visibility
- Read/write statistics
- Total I/O bandwidth usage
- Interactive process management
- Customizable display options
Installing iotop on Different Linux Distributions
Ubuntu/Debian:
sudo apt update
sudo apt install iotop
CentOS/RHEL/Fedora:
# For CentOS/RHEL 7/8
sudo yum install iotop

# For Fedora/CentOS Stream
sudo dnf install iotop
Arch Linux:
sudo pacman -S iotopopenSUSE:
sudo zypper install iotopBasic iotop Usage and Syntax
The basic syntax for iotop is:
iotop [OPTIONS]Running iotop with Default Settings:
sudo iotopSample Output:
Total DISK READ :       2.50 M/s | Total DISK WRITE :      15.20 M/s
Actual DISK READ:       2.50 M/s | Actual DISK WRITE:      12.40 M/s
  TID  PRIO  USER     DISK READ  DISK WRITE  SWAPIN     IO>    COMMAND
 3254 be/4 root        0.00 B/s   11.85 M/s  0.00 %  89.21 % [kworker/0:1H]
 1853 be/4 mysql       2.50 M/s    3.35 M/s  0.00 %  45.32 % mysqld --defaults-file=/etc/mysql/my.cnf
 2145 be/4 www-data    0.00 B/s    0.00 B/s  0.00 %   5.15 % apache2 -DFOREGROUND
 1254 be/4 root        0.00 B/s    0.00 B/s  0.00 %   2.33 % systemd-journald
Understanding iotop Output
The iotop output consists of two main sections:
Header Section:
- Total DISK READ/WRITE: Total bandwidth for disk reads and writes
- Actual DISK READ/WRITE: Actual bandwidth to/from storage devices
Process Table Columns:
- TID: Thread ID
- PRIO: I/O priority (rt=real-time, be=best-effort, idle=idle)
- USER: User running the process
- DISK READ: Bandwidth of disk reads
- DISK WRITE: Bandwidth of disk writes
- SWAPIN: Percentage of time spent swapping in
- IO: Percentage of time spent in I/O
- COMMAND: Command name/line
Essential iotop Command Options
Display Only Active Processes (-o, –only):
sudo iotop -oThis option shows only processes or threads that are actively performing I/O operations.
Show Processes Instead of Threads (-P, –processes):
sudo iotop -PGroups threads by process, showing process-level I/O statistics instead of individual threads.
Show Accumulated I/O (-a, –accumulated):
sudo iotop -aDisplays accumulated I/O instead of bandwidth, showing total bytes read/written since iotop started.
Non-Interactive Mode (-b, –batch):
sudo iotop -b -n 3Runs in batch mode with 3 iterations, useful for scripts and logging.
Set Update Delay (-d, –delay):
sudo iotop -d 5Sets the delay between updates to 5 seconds (default is 1 second).
Advanced iotop Usage Examples
Monitor Specific User Activity:
sudo iotop -u mysqlShows I/O activity only for processes owned by the mysql user.
Monitor with Custom Delay and Process View:
sudo iotop -P -d 2 -oUpdates every 2 seconds, shows processes instead of threads, and displays only active processes.
Export I/O Data for Analysis:
sudo iotop -b -n 10 -d 5 -o > io_analysis.txtCaptures 10 snapshots every 5 seconds of active processes and saves to a file.
Monitor High I/O Processes:
sudo iotop -a -o -d 3Shows accumulated I/O for active processes with 3-second intervals.
Interactive iotop Commands
While iotop is running interactively, you can use these keyboard shortcuts:
| Key | Action |
|---|---|
r |
Reverse sort order |
o |
Toggle showing only active processes |
p |
Toggle between processes and threads |
a |
Toggle between bandwidth and accumulated I/O |
q |
Quit iotop |
i |
Change I/O priority of a process |
Practical Use Cases and Examples
1. Identifying Database Performance Issues:
sudo iotop -u mysql -P -aMonitor MySQL processes to identify high I/O operations that might indicate inefficient queries or missing indexes.
2. Web Server I/O Analysis:
sudo iotop -u www-data -o -d 1Monitor Apache/Nginx processes for high I/O activity that could indicate log writing issues or file serving bottlenecks.
3. System Backup Monitoring:
sudo iotop -P -d 5Monitor backup processes to ensure they’re not overwhelming the system’s I/O capacity.
4. Development Environment Optimization:
sudo iotop -u developer -a -oTrack I/O patterns during development to optimize application performance.
Troubleshooting Common iotop Issues
Permission Denied Error:
If you see “Permission denied” errors, ensure you’re running iotop as root or with sudo:
sudo iotopCONFIG_TASKSTATS Not Enabled:
If iotop fails to start, check if the required kernel options are enabled:
zcat /proc/config.gz | grep -E "(CONFIG_TASKSTATS|CONFIG_TASK_DELAY_ACCT)"High CPU Usage by iotop:
Reduce the update frequency to lower CPU usage:
sudo iotop -d 5 # Update every 5 seconds instead of 1Alternative I/O Monitoring Tools
iostat (from sysstat package):
iostat -x 1Provides device-level I/O statistics.
atop:
atop -d 1System and process monitor with I/O information.
pidstat:
pidstat -d 1Shows I/O statistics for individual processes.
Best Practices for Using iotop
- Start with basic monitoring: Use
sudo iotop -oto see only active processes - Combine with other tools: Use alongside
top,htop, andiostatfor comprehensive monitoring - Monitor during peak hours: Run iotop during high-traffic periods to identify bottlenecks
- Use batch mode for logging: Capture data for later analysis using the
-boption - Focus on accumulated I/O: Use
-aoption to understand total I/O impact over time - Regular monitoring: Make iotop part of your regular system monitoring routine
Security Considerations
Since iotop requires root privileges to access kernel I/O statistics, consider these security aspects:
- Only grant iotop access to trusted users
- Use sudo with specific iotop permissions instead of full root access
- Monitor iotop usage in multi-user environments
- Consider using restricted environments for iotop access
Conclusion
The iotop command is an indispensable tool for Linux system administrators and developers who need to monitor and optimize disk I/O performance. By understanding its features, options, and best practices, you can effectively identify I/O bottlenecks, optimize system performance, and maintain healthy server environments.
Whether you’re troubleshooting slow database queries, monitoring backup processes, or optimizing application performance, iotop provides the real-time visibility needed to make informed decisions about your system’s I/O usage. Regular use of iotop as part of your monitoring toolkit will help ensure optimal system performance and quick identification of potential issues.
Remember to combine iotop with other system monitoring tools for a comprehensive view of your system’s performance, and always run it with appropriate permissions to access the kernel’s I/O statistics effectively.
Related Posts
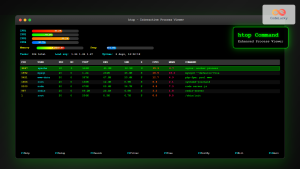
htop Command Linux: Complete Guide to Advanced Process Monitoring and Management
The htop command is an enhanced, interactive version of the traditional top command that provides real-time monitoring of system processes...

top Command Linux: Complete Guide to Real-Time Process Monitoring
The top command is one of the most essential tools in a Linux system administrator's arsenal. It provides real-time information...
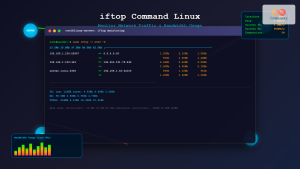
iftop Command Linux: Monitor Network Traffic and Display Bandwidth Usage by Connection
The iftop command is a powerful network monitoring tool in Linux that displays real-time bandwidth usage by network connections. Similar...
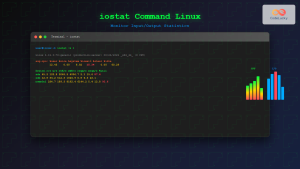
iostat Command Linux: Complete Guide to Monitor Input Output Statistics and System Performance
The iostat command is an essential Linux system monitoring tool that provides detailed input/output statistics for devices and partitions. As...
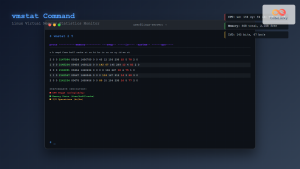
vmstat Command Linux: Monitor Virtual Memory and System Performance Statistics
The vmstat command is one of the most powerful and essential tools for Linux system administrators and developers to monitor...
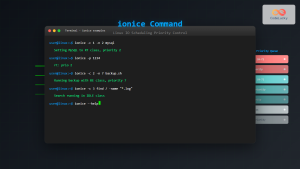
ionice Command Linux: Master IO Scheduling Priority for Optimal System Performance
The ionice command is a powerful Linux utility that allows system administrators and developers to control the Input/Output (IO) scheduling...
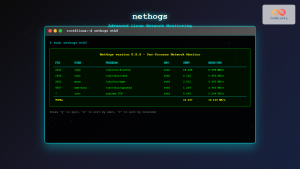
nethogs Advanced Linux: Complete Guide to Per-Process Network Monitoring
Network monitoring is crucial for system administrators and developers who need to track bandwidth usage and identify network-intensive processes. While...
sar Command Linux: System Activity Reporter for Performance Monitoring
The sar (System Activity Reporter) command is one of the most powerful and comprehensive system monitoring tools available in Linux....
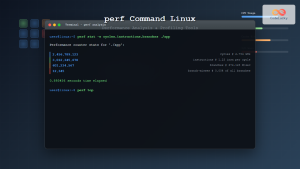
perf Command Linux: Complete Performance Analysis and Profiling Guide
The perf command is one of the most powerful performance analysis tools available in Linux, offering comprehensive insights into system...
ps Command in Linux: Complete Guide to Process Monitoring and Management
The ps command is one of the most fundamental and powerful tools in Linux for displaying information about running processes....

ptrace Command Linux: Complete Guide to Process Tracing System Call
The ptrace system call is one of Linux's most powerful tools for process monitoring and debugging. It allows one process...
uptime Command Linux: Complete Guide to System Uptime and Load Average Monitoring
The uptime command is one of the most fundamental system monitoring tools in Linux, providing essential information about how long...


