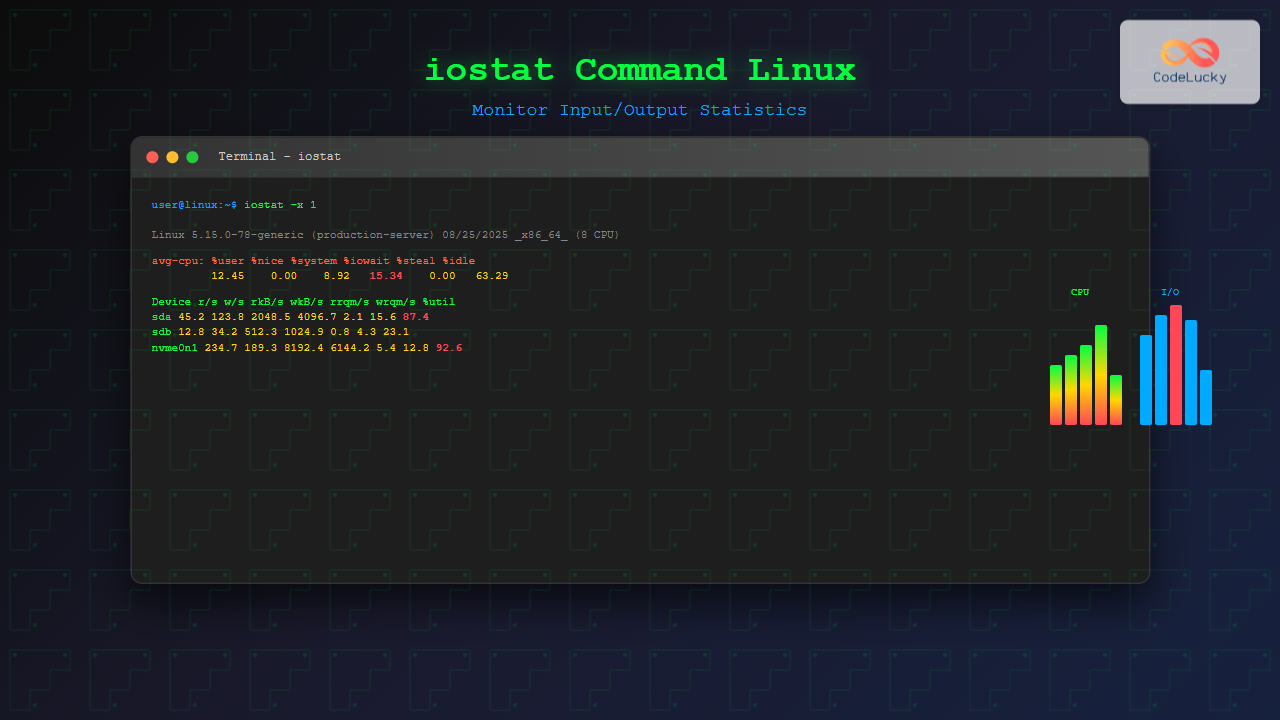
The iostat command is an essential Linux system monitoring tool that provides detailed input/output statistics for devices and partitions. As part of the sysstat package, iostat helps system administrators identify performance bottlenecks, monitor disk utilization, and optimize system performance through comprehensive I/O analysis.
What is iostat Command?
The iostat (Input/Output Statistics) command displays kernel-maintained statistics for input and output operations on physical devices. It provides crucial insights into:
- CPU utilization patterns
- Device utilization statistics
- Throughput and service time metrics
- Queue depths and wait times
- Read/write operation frequencies
Installing iostat
The iostat command comes as part of the sysstat package. Install it using your distribution’s package manager:
Ubuntu/Debian:
sudo apt update
sudo apt install sysstat
CentOS/RHEL/Fedora:
# CentOS/RHEL
sudo yum install sysstat

# Fedora
sudo dnf install sysstat
Basic iostat Syntax
iostat [options] [interval] [count]- interval: Time between reports (in seconds)
- count: Number of reports to generate
- options: Various flags to customize output
Understanding iostat Output
Let’s examine a basic iostat command output:
$ iostat
Linux 5.4.0-74-generic (server01)     08/25/2025     _x86_64_    (4 CPU)

avg-cpu:  %user   %nice %system %iowait    %steal     %idle
           2.50    0.00    1.25    0.75      0.00     95.50

Device             tps    kB_read/s    kB_wrtn/s    kB_read    kB_wrtn
sda               1.23        25.67        15.34     1234567     789123
sdb               0.45         8.92         3.21      456789     165432
CPU Statistics Explanation:
| Metric | Description |
|---|---|
| %user | CPU time spent on user processes |
| %nice | CPU time spent on niced user processes |
| %system | CPU time spent on system processes |
| %iowait | CPU time waiting for I/O operations |
| %steal | CPU time stolen by hypervisor (virtualized environments) |
| %idle | CPU idle time |
Device Statistics Explanation:
| Metric | Description |
|---|---|
| tps | Transfers per second (I/O requests) |
| kB_read/s | Kilobytes read per second |
| kB_wrtn/s | Kilobytes written per second |
| kB_read | Total kilobytes read |
| kB_wrtn | Total kilobytes written |
Essential iostat Options
1. Extended Statistics (-x)
The -x option provides extended statistics with additional performance metrics:
$ iostat -x
Device:         rrqm/s   wrqm/s     r/s     w/s    rkB/s    wkB/s avgrq-sz avgqu-sz   await r_await w_await  svctm  %util
sda               0.12     2.45    1.23    0.89    25.67    15.34    38.65     0.02   12.34    8.45   17.89   4.56   0.97
Extended Metrics Explained:
| Metric | Description |
|---|---|
| rrqm/s | Read requests merged per second |
| wrqm/s | Write requests merged per second |
| r/s | Read requests per second |
| w/s | Write requests per second |
| avgrq-sz | Average request size in sectors |
| avgqu-sz | Average queue length |
| await | Average wait time (ms) |
| svctm | Average service time (ms) |
| %util | Device utilization percentage |
2. CPU-Only Statistics (-c)
$ iostat -c
Linux 5.4.0-74-generic (server01)     08/25/2025     _x86_64_    (4 CPU)

avg-cpu:  %user   %nice %system %iowait    %steal     %idle
           2.50    0.00    1.25    0.75      0.00     95.50
3. Device-Only Statistics (-d)
$ iostat -d
Linux 5.4.0-74-generic (server01)     08/25/2025     _x86_64_    (4 CPU)

Device             tps    kB_read/s    kB_wrtn/s    kB_read    kB_wrtn
sda               1.23        25.67        15.34     1234567     789123
sdb               0.45         8.92         3.21      456789     165432
Advanced iostat Usage Examples
1. Continuous Monitoring
Monitor I/O statistics every 2 seconds:
$ iostat -x 2Generate 5 reports with 3-second intervals:
$ iostat -x 3 52. Specific Device Monitoring
Monitor specific devices:
$ iostat -x sda sdb 23. Human-Readable Output (-h)
$ iostat -h -x 1 3
Device            r/s     w/s     rMB/s     wMB/s   rrqm/s   wrqm/s  %rrqm  %wrqm r_await w_await aqu-sz rareq-sz wareq-sz  svctm  %util
sda              1.23    0.89      0.03      0.02     0.12     2.45   8.89  73.33    8.45   17.89   0.02    25.67    17.23   4.56   0.97
4. Network File System Statistics (-n)
$ iostat -n5. Timestamp Information (-t)
$ iostat -t -x 2 3
08/25/2025 06:04:15 AM
Device            r/s     w/s     rkB/s     wkB/s   rrqm/s   wrqm/s  %rrqm  %wrqm r_await w_await aqu-sz rareq-sz wareq-sz  svctm  %util
sda              1.23    0.89     25.67     15.34     0.12     2.45   8.89  73.33    8.45   17.89   0.02    41.72    34.46   4.56   0.97
Real-World Performance Analysis Scenarios
Scenario 1: High I/O Wait Investigation
When experiencing system slowness, check for high I/O wait:
$ iostat -c 1 10Look for:
- %iowait > 10%: Indicates I/O bottlenecks
- %system > 30%: High system overhead
- %idle < 50%: System under heavy load
Scenario 2: Disk Performance Bottleneck
$ iostat -x 2 5Critical metrics to monitor:
- %util > 80%: Device saturation
- avgqu-sz > 1.0: Queue buildup
- await > 10ms: High latency
- svctm approaching await: Device limitation
Scenario 3: SSD vs HDD Performance Comparison
$ iostat -x sda sdb 1Expected SSD characteristics:
- Lower await times (< 1ms)
- Higher IOPS capability
- More consistent performance
Performance Optimization Tips
1. Identifying I/O Patterns
$ iostat -x 1 | grep -E "(Device|sda)"2. Monitoring Specific Partitions
$ iostat -p sda 23. Creating Custom Reports
$ iostat -x -t 5 > /var/log/iostat.log &Troubleshooting Common Issues
Issue 1: Command Not Found
Solution: Install sysstat package
sudo apt install sysstat  # Ubuntu/Debian
sudo yum install sysstat  # CentOS/RHEL
Issue 2: No Statistics Available
Cause: Statistics collection might be disabled
Solution: Enable statistics collection:
sudo systemctl enable sysstat
sudo systemctl start sysstat
Issue 3: Incomplete Data
Cause: Insufficient time for data collection
Solution: Allow time for kernel to collect statistics or use interval monitoring
Best Practices for iostat Usage
1. Regular Monitoring Schedule
- Use cron jobs for automated monitoring
- Set appropriate intervals (1-5 seconds for troubleshooting)
- Log historical data for trend analysis
2. Baseline Establishment
# Create baseline during normal operations
iostat -x 300 288 > baseline_iostat.log  # 24 hours of 5-minute intervals
3. Alert Thresholds
- Critical: %util > 90%, await > 50ms
- Warning: %util > 70%, await > 20ms
- Information: %iowait > 5%
Integration with Other Monitoring Tools
Combine iostat with Other Commands
# Comprehensive system analysis
iostat -x 1 1 && iotop -a -o -d 1 -n 3 && vmstat 1 3
Scripted Monitoring
#!/bin/bash
# Simple iostat monitoring script
while true; do
    echo "=== $(date) ===" >> /var/log/performance.log
    iostat -x 1 1 >> /var/log/performance.log
    sleep 300  # 5-minute intervals
done
Conclusion
The iostat command is an indispensable tool for Linux system administrators and performance analysts. By understanding its various options and output metrics, you can effectively:
- Identify I/O bottlenecks and performance issues
- Monitor system health and resource utilization
- Make informed decisions about hardware upgrades
- Optimize application performance and system configuration
Regular monitoring with iostat, combined with proper analysis and baseline comparisons, enables proactive system management and helps maintain optimal performance in production environments. Remember to establish monitoring baselines, set appropriate alert thresholds, and integrate iostat data with other system monitoring tools for comprehensive performance analysis.

