
The iftop command is a powerful network monitoring tool in Linux that displays real-time bandwidth usage by network connections. Similar to how the top command shows process activity, iftop provides a live view of network traffic flowing through your system’s network interfaces. This tool is essential for system administrators and network engineers who need to monitor network performance, identify bandwidth-heavy connections, and troubleshoot network issues.
What is iftop Command?
iftop stands for “Interface TOP” and is a command-line utility that displays bandwidth usage on an interface by host. It listens to network traffic on a specific interface and displays a table of current bandwidth usage by pairs of hosts. The tool provides real-time updates and can help identify which connections are consuming the most bandwidth.
Key Features of iftop
- Real-time monitoring: Displays live network traffic statistics
- Connection-based view: Shows traffic between specific host pairs
- Multiple time scales: Displays 2s, 10s, and 40s averages
- Port resolution: Can display service names instead of port numbers
- Filtering capabilities: Supports traffic filtering using expressions
- Interactive controls: Allows sorting and filtering during runtime
Installing iftop on Linux
Before using iftop, you need to install it on your system. The installation method varies depending on your Linux distribution:
Ubuntu/Debian
sudo apt update
sudo apt install iftop
CentOS/RHEL/Fedora
# For CentOS/RHEL 7/8
sudo yum install iftop

# For CentOS/RHEL 9 and Fedora
sudo dnf install iftop
Arch Linux
sudo pacman -S iftopBasic iftop Command Syntax
The basic syntax for the iftop command is:
iftop [options] [-i interface] [-f filter]Note: iftop requires root privileges to monitor network interfaces, so you’ll typically need to use sudo.
Understanding iftop Output
When you run iftop, it displays a screen with several sections:
Main Display
The main area shows active connections with the following columns:
- Source → Destination: Shows the connection direction
- 2s, 10s, 40s columns: Display bandwidth usage averages
- TX (Transmit): Data being sent
- RX (Receive): Data being received
- TOTAL: Combined TX and RX traffic
Bottom Statistics
The bottom section displays cumulative statistics:
- Peak: Maximum bandwidth observed
- Rates: Current TX, RX, and TOTAL rates
- Cumulative: Total data transferred since iftop started
Common iftop Command Examples
Example 1: Basic Network Monitoring
To start monitoring the default network interface:
sudo iftopSample Output:
                    12.5Kb  25.0Kb  37.5Kb  50.0Kb  62.5Kb
┌─────────────────────────────────────────────────────────
192.168.1.100                => 8.8.8.8                    1.20Kb  2.10Kb  1.85Kb
                              <=                           856b   1.45Kb  1.23Kb
192.168.1.100                => 142.250.191.78             2.45Kb  3.20Kb  2.80Kb
                              <=                           1.80Kb  2.90Kb  2.15Kb
server.local                 => 192.168.1.50               890b   1.10Kb   950b
                              <=                           1.20Kb  1.60Kb  1.35Kb
─────────────────────────────────────────────────────────
TX:             cum:   125KB   rates:   4.55Kb  6.40Kb  5.58Kb
RX:                    98.5KB           3.86Kb  5.95Kb  4.73Kb
TOTAL:                 224KB            8.41Kb 12.35Kb 10.31Kb
Example 2: Monitor Specific Interface
To monitor a specific network interface (e.g., eth0):
sudo iftop -i eth0Example 3: Display Port Numbers
To show port numbers instead of service names:
sudo iftop -PSample Output:
192.168.1.100:52847          => 8.8.8.8:53                 1.20Kb  2.10Kb  1.85Kb
                              <=                           856b   1.45Kb  1.23Kb
192.168.1.100:443            => 142.250.191.78:443         2.45Kb  3.20Kb  2.80Kb
                              <=                           1.80Kb  2.90Kb  2.15Kb
Example 4: Filter Traffic by Host
To monitor traffic to/from a specific host:
sudo iftop -f "host 8.8.8.8"Example 5: Filter by Port
To monitor only HTTP traffic (port 80):
sudo iftop -f "port 80"Example 6: Monitor Without DNS Resolution
To disable DNS lookups for faster display:
sudo iftop -nAdvanced iftop Options
Command Line Options
| Option | Description |
|---|---|
-i interface |
Specify network interface to monitor |
-P |
Display port numbers instead of service names |
-n |
Don’t resolve hostnames |
-N |
Don’t resolve port names |
-p |
Run in promiscuous mode |
-b |
Don’t display bandwidth in bytes |
-B |
Display bandwidth in bytes |
-a |
Use bytes for bandwidth display |
-F file |
Read filter from file |
-c file |
Read configuration from file |
Filter Expressions
iftop supports Berkeley Packet Filter (BPF) expressions for filtering traffic:
# Monitor only TCP traffic
sudo iftop -f "tcp"

# Monitor specific subnet
sudo iftop -f "net 192.168.1.0/24"

# Monitor traffic to specific port range
sudo iftop -f "portrange 80-443"

# Exclude specific host
sudo iftop -f "not host 192.168.1.1"

# Monitor only outgoing traffic
sudo iftop -f "src host 192.168.1.100"
Interactive Controls
While iftop is running, you can use various keyboard shortcuts to control the display:
| Key | Action |
|---|---|
h |
Show/hide help screen |
n |
Toggle DNS resolution |
N |
Toggle port resolution |
p |
Toggle promiscuous mode |
P |
Toggle port display |
s |
Toggle source sorting |
d |
Toggle destination sorting |
S |
Sort by source |
D |
Sort by destination |
t |
Toggle text interface |
f |
Edit filter |
l |
Set screen filter |
L |
Toggle scale (linear/log) |
b |
Toggle bar display |
j/k |
Scroll down/up |
q |
Quit iftop |
Practical Use Cases
1. Identifying Bandwidth-Heavy Applications
Use iftop to identify which applications or connections are consuming the most bandwidth:
sudo iftop -P -nThis command shows port numbers and disables DNS resolution for faster identification of services.
2. Monitoring Server Network Activity
For web servers, monitor HTTP and HTTPS traffic:
sudo iftop -f "port 80 or port 443"3. Detecting Unusual Network Activity
Monitor for connections to external hosts that might indicate security issues:
sudo iftop -f "not net 192.168.0.0/16 and not net 10.0.0.0/8"4. Database Server Monitoring
Monitor database connections on a MySQL server:
sudo iftop -f "port 3306"Configuration File
You can create a configuration file to set default options for iftop. Create ~/.iftoprc with your preferred settings:
# Sample .iftoprc configuration
dns-resolution: no
port-resolution: yes
show-bars: yes
promiscuous: no
port-display: on
link-local: no
hide-source: no
hide-destination: no
sort: 2s
line-display: two-line
show-totals: yes
Troubleshooting Common Issues
Permission Denied Error
If you encounter permission errors, ensure you’re running iftop with sudo:
# Wrong
iftop

# Correct
sudo iftop
Interface Not Found
If iftop can’t find your network interface, list available interfaces first:
# List network interfaces
ip link show

# Then specify the correct interface
sudo iftop -i enp0s3
No Traffic Displayed
If no traffic appears:
- Verify you’re monitoring the correct interface
- Check if there’s actual network traffic
- Try running without filters first
- Ensure the interface is active and has traffic
Alternatives to iftop
While iftop is excellent for connection-based monitoring, consider these alternatives for different use cases:
- nload: Simple interface bandwidth monitoring
- vnstat: Network statistics with historical data
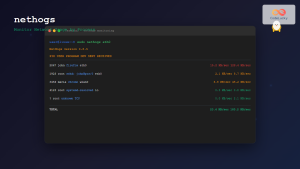
- nethogs: Process-based network monitoring
- iptraf-ng: Comprehensive network monitoring suite
- tcptrack: TCP connection monitoring
Best Practices
1. Regular Monitoring
Set up regular monitoring sessions to establish baseline network behavior:
# Monitor for 5 minutes and save output
sudo iftop -t -s 300 > network_baseline.txt
2. Use Appropriate Filters
Apply filters to focus on relevant traffic and reduce noise:
# Focus on external traffic only
sudo iftop -f "not net 192.168.0.0/16"
3. Combine with Other Tools
Use iftop alongside other monitoring tools for comprehensive analysis:
# Run iftop in one terminal
sudo iftop

# Monitor processes in another terminal
sudo nethogs
4. Document Unusual Patterns
Keep records of unusual network patterns for security analysis and capacity planning.
Security Considerations
When using iftop for network monitoring:
- Privileged access: iftop requires root privileges, so ensure proper access controls
- Data sensitivity: Network traffic data can be sensitive; protect logs appropriately
- Promiscuous mode: Use promiscuous mode carefully as it can capture all network traffic
- Compliance: Ensure monitoring activities comply with organizational policies and regulations
Conclusion
The iftop command is an invaluable tool for Linux system administrators and network engineers who need real-time visibility into network traffic patterns. Its ability to display bandwidth usage by connection makes it particularly useful for identifying performance bottlenecks, monitoring application behavior, and troubleshooting network issues.
By mastering iftop’s various options, filters, and interactive controls, you can effectively monitor network performance and make informed decisions about network optimization and security. Whether you’re managing a single server or a complex network infrastructure, iftop provides the real-time insights needed to maintain optimal network performance.
Remember to combine iftop with other monitoring tools and establish regular monitoring practices to get the most value from your network monitoring efforts. With its powerful filtering capabilities and real-time display, iftop remains one of the most essential tools in the Linux administrator’s toolkit.
Related Posts
nethogs Command Linux: Monitor Real-Time Network Usage by Process
Network monitoring is a crucial aspect of system administration, especially when you need to identify which processes are consuming bandwidth...
jnettop Command Linux: Monitor Real-Time Network Traffic by Connection
The jnettop command is a powerful Linux network monitoring tool that provides real-time visibility into network traffic organized by individual...
nethogs Advanced Linux: Complete Guide to Per-Process Network Monitoring
Network monitoring is crucial for system administrators and developers who need to track bandwidth usage and identify network-intensive processes. While...

iptraf Command Linux: Complete Interactive Network Monitoring Guide
The iptraf command is a powerful console-based network monitoring utility for Linux systems that provides real-time IP LAN monitoring capabilities....
nload Command Linux: Complete Guide to Monitor Network Traffic and Bandwidth in Real-Time
The nload command is a powerful Linux utility that provides real-time monitoring of network traffic and bandwidth usage. Unlike basic...
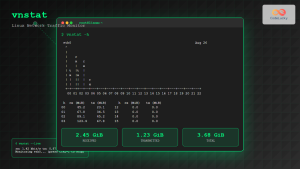
vnstat Command Linux: Complete Network Traffic Monitoring Guide
Network traffic monitoring is a crucial aspect of system administration, and the vnstat command in Linux provides an elegant solution...
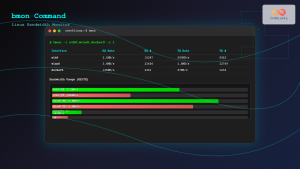
bmon Command Linux: Complete Guide to Real-Time Bandwidth Monitoring and Network Analysis
The bmon (Bandwidth Monitor) command is a powerful Linux utility designed for real-time network bandwidth monitoring and rate estimation. This...
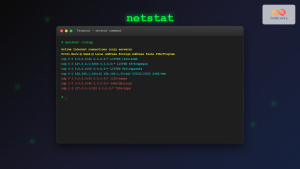
netstat Command Linux: Complete Guide to Network Connection Monitoring
The netstat command is one of the most essential network monitoring tools in Linux systems. It provides comprehensive information about...

cbm Command Linux: Monitor Network Bandwidth in Real-Time with Color Display
The cbm (Color Bandwidth Meter) command is a powerful Linux utility that provides real-time monitoring of network bandwidth usage with...
htop Command Linux: Complete Guide to Advanced Process Monitoring and Management
The htop command is an enhanced, interactive version of the traditional top command that provides real-time monitoring of system processes...
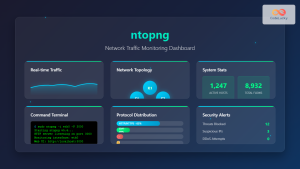
ntopng Command Linux: Complete Guide to Web-Based Network Traffic Monitoring
Network traffic monitoring is crucial for maintaining optimal network performance, security, and troubleshooting connectivity issues. The ntopng command provides a...
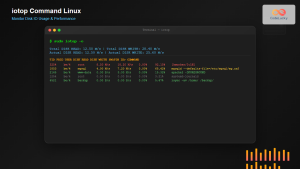
iotop Command Linux: Complete Guide to Monitor Disk IO Usage and Performance
The iotop command is an essential Linux utility that provides real-time monitoring of disk I/O usage by processes and threads....
- What is iftop Command?
- Installing iftop on Linux
- Basic iftop Command Syntax
- Understanding iftop Output
- Common iftop Command Examples
- Advanced iftop Options
- Interactive Controls
- Practical Use Cases
- Configuration File
- Troubleshooting Common Issues
- Alternatives to iftop
- Best Practices
- Security Considerations
- Conclusion


