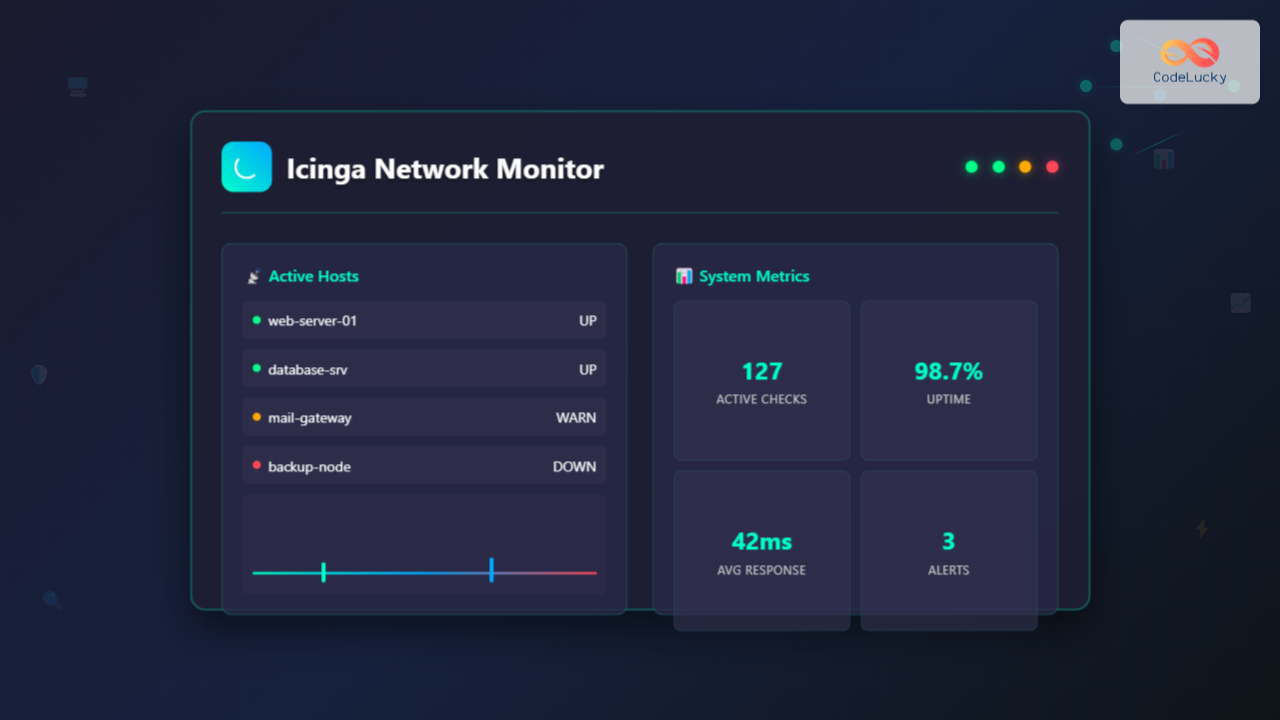
Icinga is a powerful open-source network monitoring system that helps system administrators monitor network resources, notify users of outages, and generate performance data for reporting purposes. Originally forked from Nagios, Icinga has evolved into a modern, feature-rich monitoring solution with enhanced web interfaces and advanced configuration options.
What is Icinga?
Icinga is a comprehensive monitoring system that provides real-time monitoring of hosts, services, and network infrastructure. It offers two main versions:
- Icinga 1: The original fork from Nagios with improved features
- Icinga 2: A complete rewrite with modern architecture and enhanced capabilities
The system excels in monitoring availability, performance metrics, and generating alerts when issues arise, making it essential for maintaining robust IT infrastructure.
Key Features of Icinga
Icinga provides numerous features that make it stand out among monitoring solutions:
- Scalable Architecture: Supports distributed monitoring across multiple locations
- Web Interface: Modern web-based dashboard for easy management
- Flexible Configuration: Object-oriented configuration system
- Notification System: Multiple notification methods including email, SMS, and webhooks
- Performance Data: Integration with graphing tools like Grafana
- API Support: RESTful API for automation and integration
System Requirements
Before installing Icinga, ensure your Linux system meets these requirements:
- Operating System: Ubuntu 18.04+, CentOS 7+, Debian 9+, or RHEL 7+
- RAM: Minimum 2GB (4GB recommended for production)
- CPU: 2 cores minimum
- Disk Space: 10GB minimum for installation and logs
- Network: Stable internet connection for package installation
Installing Icinga on Linux
Ubuntu/Debian Installation
Follow these steps to install Icinga 2 on Ubuntu or Debian systems:
# Add Icinga repository
curl -s https://packages.icinga.com/icinga.key | apt-key add -
echo "deb https://packages.icinga.com/ubuntu icinga-$(lsb_release -cs) main" | tee /etc/apt/sources.list.d/icinga.list

# Update package list
sudo apt update

# Install Icinga 2
sudo apt install icinga2 monitoring-plugins
Expected Output:
Reading package lists... Done
Building dependency tree... Done
The following additional packages will be installed:
  icinga2-bin icinga2-common icinga2-doc
The following NEW packages will be installed:
  icinga2 icinga2-bin icinga2-common icinga2-doc monitoring-plugins
0 upgraded, 5 newly installed, 0 to remove and 0 not upgraded.
Need to get 15.2 MB of archives.
After this operation, 45.8 MB of additional disk space will be used.
CentOS/RHEL Installation
For Red Hat-based distributions, use these commands:
# Add Icinga repository
rpm --import https://packages.icinga.com/icinga.key
curl -o /etc/yum.repos.d/ICINGA-release.repo https://packages.icinga.com/centos/ICINGA-release.repo

# Install Icinga 2
sudo yum install icinga2 nagios-plugins-all

# Enable and start the service
sudo systemctl enable icinga2
sudo systemctl start icinga2
Basic Configuration
Main Configuration File
The primary configuration file is located at /etc/icinga2/icinga2.conf. Here’s the basic structure:
/**
 * Icinga 2 configuration file
 * - this is where you define settings for the Icinga application
 */

include "constants.conf"
include "zones.conf"
include "features-available/*.conf"

/**
 * Include the hosts configuration
 */
include_recursive "conf.d"
Configuring Host Monitoring
Create a host definition in /etc/icinga2/conf.d/hosts.conf:
object Host "web-server-01" {
  import "generic-host"

  address = "192.168.1.100"
  check_command = "hostalive"

  vars.os = "Linux"
  vars.sla = "24x7"

  groups = [ "linux-servers", "web-servers" ]
}

object Host "database-server" {
  import "generic-host"

  address = "192.168.1.200"
  check_command = "hostalive"

  vars.os = "Linux"
  vars.sla = "critical"

  groups = [ "linux-servers", "database-servers" ]
}
Service Monitoring Configuration
Define services in /etc/icinga2/conf.d/services.conf:
apply Service "ping4" {
  import "generic-service"

  check_command = "ping4"

  assign where host.address
}

apply Service "ssh" {
  import "generic-service"

  check_command = "ssh"

  assign where (host.address || host.address6) && host.vars.os == "Linux"
}

apply Service "http" {
  import "generic-service"

  check_command = "http"

  assign where "web-servers" in host.groups
}

apply Service "mysql" {
  import "generic-service"

  check_command = "mysql"

  vars.mysql_database = "testdb"
  vars.mysql_username = "monitoring"
  vars.mysql_password = "monitor_password"

  assign where "database-servers" in host.groups
}
Command Line Usage
Basic Commands
Here are essential Icinga 2 command-line operations:
# Check configuration syntax
sudo icinga2 daemon -C

# Start Icinga 2 service
sudo systemctl start icinga2

# Check service status
sudo systemctl status icinga2

# Restart Icinga 2
sudo systemctl restart icinga2

# View logs
sudo journalctl -u icinga2 -f
Configuration Check Output:
[2025-08-26 05:09:15 +0530] information/cli: Icinga application loader (version: r2.13.7-1)
[2025-08-26 05:09:15 +0530] information/cli: Loading configuration file(s).
[2025-08-26 05:09:16 +0530] information/ConfigItem: Committing config item(s).
[2025-08-26 05:09:16 +0530] information/ApiListener: My API identity: web-server-01
[2025-08-26 05:09:16 +0530] information/ConfigItem: Instantiated 1 Host.
[2025-08-26 05:09:16 +0530] information/ConfigItem: Instantiated 3 Service.
[2025-08-26 05:09:16 +0530] information/ConfigItem: Instantiated 1 CheckCommand.
configuration validation successful
Feature Management
Icinga 2 uses features for different functionalities. Enable common features:
# Enable command feature for external commands
sudo icinga2 feature enable command

# Enable performance data feature
sudo icinga2 feature enable perfdata

# Enable notification feature
sudo icinga2 feature enable notification

# List enabled features
sudo icinga2 feature list
Feature List Output:
Disabled features: api checker debuglog gelf graphite icingadb influxdb livestatus opentsdb statusdata syslog
Enabled features: command mainlog notification perfdata
Installing Icinga Web 2
Icinga Web 2 provides a modern web interface for monitoring and management:
# Install Icinga Web 2 (Ubuntu/Debian)
sudo apt install icingaweb2 icingacli

# Install required PHP modules
sudo apt install php-mysql php-pgsql php-ldap php-gd php-curl php-xml

# Configure database (MySQL example)
sudo mysql -u root -p

CREATE DATABASE icingaweb2;
GRANT SELECT, INSERT, UPDATE, DELETE, DROP, CREATE VIEW, INDEX, EXECUTE ON icingaweb2.* TO 'icingaweb2'@'localhost' IDENTIFIED BY 'secure_password';
FLUSH PRIVILEGES;
EXIT;

# Import database schema
sudo mysql -u root -p icingaweb2 < /usr/share/icingaweb2/etc/schema/mysql.schema.sql
Advanced Configuration Examples
Custom Check Commands
Create custom monitoring commands in /etc/icinga2/conf.d/commands.conf:
object CheckCommand "check_disk_space" {
  import "plugin-check-command"

  command = [ PluginDir + "/check_disk" ]

  arguments = {
    "-w" = {
      value = "$disk_warning$"
      description = "Warning threshold"
    }
    "-c" = {
      value = "$disk_critical$"
      description = "Critical threshold"
    }
    "-p" = {
      value = "$disk_partition$"
      description = "Partition to check"
    }
  }

  vars.disk_warning = "80%"
  vars.disk_critical = "90%"
  vars.disk_partition = "/"
}

object CheckCommand "check_load_average" {
  import "plugin-check-command"

  command = [ PluginDir + "/check_load" ]

  arguments = {
    "-w" = "$load_warning$"
    "-c" = "$load_critical$"
  }

  vars.load_warning = "5.0,4.0,3.0"
  vars.load_critical = "10.0,6.0,4.0"
}
Notification Configuration
Configure notifications in /etc/icinga2/conf.d/notifications.conf:
apply Notification "mail-icingaadmin" to Host {
  import "mail-host-notification"

  command = "mail-host-notification"

  users = [ "icingaadmin" ]

  assign where host.vars.notification.mail
}

apply Notification "mail-icingaadmin" to Service {
  import "mail-service-notification"

  command = "mail-service-notification"

  users = [ "icingaadmin" ]

  assign where host.vars.notification.mail
}

object User "icingaadmin" {
  import "generic-user"

  display_name = "Icinga 2 Admin"
  groups = [ "icingaadmins" ]

  email = "[email protected]"
}
Performance Tuning
Optimize Icinga 2 for better performance with these configurations:
# In /etc/icinga2/icinga2.conf
object IcingaApplication "app" {
  enable_perfdata = true

  # Increase concurrent checks
  environment = {
    "ICINGA2_MAX_CONCURRENT_CHECKS" = "512"
  }
}

# Configure check intervals in constants.conf
const CheckInterval = 5m
const RetryInterval = 1m
const MaxCheckAttempts = 3
Troubleshooting Common Issues
Configuration Validation
Always validate configuration before restarting:
# Validate configuration
sudo icinga2 daemon -C

# Check for specific errors
sudo icinga2 daemon -C --log-level information
Log Analysis
Monitor Icinga logs for issues:
# View real-time logs
sudo tail -f /var/log/icinga2/icinga2.log

# Check for specific errors
sudo grep -i error /var/log/icinga2/icinga2.log

# Check service-specific logs
sudo journalctl -u icinga2 --since "1 hour ago"
Common Error Solutions
Problem: “Config validation failed”
# Check syntax errors in configuration files
sudo icinga2 daemon -C

# Common fix: Check for missing semicolons or brackets
# Verify object definitions are complete
Problem: Services not being checked
# Verify feature is enabled
sudo icinga2 feature enable checker

# Check if host is reachable
sudo icinga2 console
>>> get_host("hostname").last_check_result
Security Best Practices
Implement these security measures for production deployments:
- API Security: Use certificates for API authentication
- File Permissions: Restrict configuration file access
- Network Security: Use firewalls to limit access
- Regular Updates: Keep Icinga and plugins updated
# Secure configuration files
sudo chmod 640 /etc/icinga2/conf.d/*.conf
sudo chown icinga:icinga /etc/icinga2/conf.d/*.conf

# Generate API certificates
sudo icinga2 api setup
Integration with Other Tools
Grafana Integration
Connect Icinga with Grafana for advanced visualization:
# Enable InfluxDB feature
sudo icinga2 feature enable influxdb

# Configure InfluxDB connection in features-available/influxdb.conf
object InfluxdbWriter "influxdb" {
  host = "127.0.0.1"
  port = 8086
  database = "icinga2"

  host_template = {
    measurement = "$host.check_command$"
    tags = {
      hostname = "$host.name$"
    }
  }

  service_template = {
    measurement = "$service.check_command$"
    tags = {
      hostname = "$host.name$"
      service = "$service.name$"
    }
  }
}
Conclusion
Icinga provides a robust, scalable solution for network and system monitoring in Linux environments. Its flexible configuration system, modern web interface, and extensive plugin ecosystem make it suitable for organizations of all sizes. By following the installation steps, configuration examples, and best practices outlined in this guide, you can implement a comprehensive monitoring solution that ensures high availability and performance of your IT infrastructure.
Regular maintenance, proper configuration management, and continuous monitoring of the Icinga system itself are key to maintaining an effective monitoring environment. As your infrastructure grows, Icinga’s distributed monitoring capabilities and API integration options provide the scalability needed for enterprise environments.

