
Hyperic is a powerful open-source application performance monitoring (APM) platform that provides comprehensive insights into your Linux systems and applications. Originally developed by Hyperic Inc. and later acquired by VMware, this robust monitoring solution helps system administrators and DevOps teams maintain optimal performance across their infrastructure.
What is Hyperic Linux Monitoring?
Hyperic offers a unified monitoring platform that tracks system resources, application performance, and network services across Linux environments. It combines real-time monitoring with historical analysis, enabling proactive system management and quick troubleshooting.
Key Features of Hyperic
- Multi-platform Support: Monitors Linux, Windows, and Unix systems
- Auto-discovery: Automatically detects applications and services
- Alerting System: Configurable alerts for critical events
- Performance Metrics: CPU, memory, disk, and network monitoring
- Application Monitoring: Database, web server, and application server tracking
- Scalable Architecture: Supports enterprise-level deployments
Installing Hyperic on Linux
Before installing Hyperic, ensure your Linux system meets the minimum requirements:
- Linux kernel 2.6 or higher
- Java Runtime Environment (JRE) 1.6 or later
- Minimum 2GB RAM (4GB recommended)
- 10GB available disk space
Step 1: Download and Extract Hyperic
# Download Hyperic HQ Server
wget https://support.hyperic.com/download/hyperic-hq-server-5.8.4-linux.tar.gz

# Extract the archive
tar -xzf hyperic-hq-server-5.8.4-linux.tar.gz

# Navigate to the directory
cd hyperic-hq-server-5.8.4
Step 2: Configure Database
Hyperic requires a database backend. PostgreSQL is recommended for production environments:
# Install PostgreSQL
sudo apt-get update
sudo apt-get install postgresql postgresql-contrib

# Create Hyperic database
sudo -u postgres createdb hypericdb
sudo -u postgres createuser hyperic

# Set password for hyperic user
sudo -u postgres psql
ALTER USER hyperic PASSWORD 'your_password';
GRANT ALL PRIVILEGES ON DATABASE hypericdb TO hyperic;
Step 3: Install Hyperic Server
# Run the installer
./setup.sh

# Follow the interactive prompts:
# - Accept license agreement
# - Choose installation directory
# - Configure database connection
# - Set admin credentials
Example configuration during installation:
Installation Directory: /opt/hyperic
Database Type: PostgreSQL
Database URL: jdbc:postgresql://localhost:5432/hypericdb
Database Username: hyperic
Database Password: your_password
Admin Username: hqadmin
Admin Password: hqadmin123
Configuring Hyperic Agent
The Hyperic Agent collects metrics from monitored systems and sends them to the HQ Server.
Agent Installation
# Download and extract agent
wget https://support.hyperic.com/download/hyperic-hq-agent-5.8.4-linux.tar.gz
tar -xzf hyperic-hq-agent-5.8.4-linux.tar.gz
cd hyperic-hq-agent-5.8.4

# Run agent setup
./setup.sh
Agent Configuration
Configure the agent to connect to your HQ Server:
# Edit agent properties
vim conf/agent.properties

# Key configuration parameters:
agent.setup.camIP=192.168.1.100
agent.setup.camPort=7080
agent.setup.camSSL=false
agent.setup.camLoginUsername=hqadmin
agent.setup.camLoginPassword=hqadmin123
Starting the Agent
# Start the agent
./hq-agent.sh start

# Verify agent status
./hq-agent.sh status

# Example output:
HQ Agent (pid 12345) is running...
System Resource Monitoring
Hyperic provides comprehensive system monitoring capabilities for Linux environments.
CPU Monitoring
Monitor CPU utilization across all cores:
# View CPU metrics in Hyperic CLI
hq-cli.sh -h localhost -p 7080 -u hqadmin -P hqadmin123 \
  get metric "CPU Usage" for platform "linux-server-01"

# Example output:
Timestamp: 2025-08-26 07:30:00
CPU Usage: 45.2%
CPU Idle: 54.8%
CPU System: 12.3%
CPU User: 32.9%
Memory Monitoring
Track memory usage and available resources:
# Memory metrics command
hq-cli.sh get metric "Memory Usage" for platform "linux-server-01"

# Sample output:
Total Memory: 8192 MB
Used Memory: 4096 MB (50%)
Free Memory: 4096 MB (50%)
Cached Memory: 1024 MB
Buffer Memory: 512 MB
Disk Space Monitoring
Monitor disk usage across mounted filesystems:
# Disk utilization metrics
hq-cli.sh get metric "Disk Usage" for platform "linux-server-01"

# Example output:
/dev/sda1 (/): 75% used (45GB/60GB)
/dev/sda2 (/home): 60% used (120GB/200GB)
/dev/sda3 (/var): 85% used (170GB/200GB)
Application Performance Monitoring
Web Server Monitoring
Monitor Apache HTTP Server performance:
# Auto-discover Apache services
hq-cli.sh autodiscover platform "linux-server-01"

# View Apache metrics
hq-cli.sh get metric "Requests per Second" for service "Apache 2.4"

# Sample output:
Current Requests/sec: 125.5
Total Requests: 1,250,000
Active Connections: 45
Idle Workers: 105
Busy Workers: 15
Database Monitoring
Monitor MySQL database performance:
# MySQL connection monitoring
hq-cli.sh get metric "Connection Count" for service "MySQL 8.0"

# Example output:
Active Connections: 25
Max Connections: 151
Connection Usage: 16.6%
Queries per Second: 45.2
Slow Queries: 2
Java Application Monitoring
Monitor JVM-based applications:
# Tomcat monitoring example
hq-cli.sh get metric "Heap Memory Usage" for service "Tomcat 9.0"

# Output:
Heap Memory Used: 512 MB
Heap Memory Max: 1024 MB
Heap Memory Usage: 50%
GC Collections: 1,250
GC Time: 5.2 seconds
Setting Up Alerts and Notifications
Creating Alert Definitions
Configure alerts for critical system events:
# Create CPU usage alert
hq-cli.sh create alert-definition \
  --name "High CPU Usage" \
  --description "Alert when CPU usage exceeds 80%" \
  --metric "CPU Usage" \
  --condition ">" \
  --threshold 80 \
  --resource-type "Platform"
Email Notification Setup
Configure email notifications for alerts:
# Configure SMTP settings
vim conf/hyperic-hq-server.conf

# Add email configuration:
hyperic.smtp.host=smtp.company.com
hyperic.smtp.port=587
[email protected]
hyperic.smtp.password=smtp_password
[email protected]
Performance Optimization Techniques
Agent Optimization
Optimize agent performance for large-scale deployments:
# Edit agent properties for optimization
vim conf/agent.properties

# Performance tuning parameters:
agent.maxBatchSize=500
agent.batchInterval=60000
agent.queueSize=10000
agent.compression=true
Server Optimization
Optimize HQ Server for better performance:
# JVM tuning in startup script
vim bin/hq-server.sh

# Add JVM options:
export JAVA_OPTS="-Xms2g -Xmx4g -XX:NewRatio=2 \
  -XX:+UseG1GC -XX:MaxGCPauseMillis=200"
Troubleshooting Common Issues
Agent Connection Problems
Diagnose agent connectivity issues:
# Check agent logs
tail -f logs/agent.log

# Test connectivity
telnet hyperic-server 7080

# Verify agent configuration
grep -E "camIP|camPort" conf/agent.properties
Performance Issues
Identify and resolve performance bottlenecks:
# Check server logs for errors
tail -f logs/hq-server.log | grep ERROR

# Monitor database connections
psql -h localhost -U hyperic -d hypericdb -c \
  "SELECT count(*) FROM pg_stat_activity;"

# Review system resources
top -p $(pgrep -f hyperic)
Best Practices for Hyperic Deployment
Security Considerations
- Use SSL/TLS encryption for agent-server communication
- Implement strong authentication credentials
- Regularly update Hyperic components
- Restrict network access to monitoring ports
Scalability Planning
- Distribute agents across multiple servers
- Implement database clustering for high availability
- Use load balancers for HQ Server instances
- Plan for data retention and archival
Maintenance Procedures
# Regular maintenance script
#!/bin/bash
# Hyperic maintenance script

# Backup database
pg_dump -U hyperic hypericdb > hyperic_backup_$(date +%Y%m%d).sql

# Clean old log files
find /opt/hyperic/logs -name "*.log.*" -mtime +30 -delete

# Restart services if needed
./hq-server.sh restart
./hq-agent.sh restart
Advanced Monitoring Scenarios
Custom Metric Collection
Create custom metrics for specialized monitoring:
# Custom script for application metrics
#!/bin/bash
# custom_app_metrics.sh

APP_RESPONSE_TIME=$(curl -w "%{time_total}" -s -o /dev/null http://localhost:8080/health)
echo "app.response.time:${APP_RESPONSE_TIME}:gauge"

QUEUE_SIZE=$(rabbitmqctl list_queues | awk '{sum+=$2} END {print sum}')
echo "app.queue.size:${QUEUE_SIZE}:gauge"
Integration with External Tools
Integrate Hyperic with popular DevOps tools:
# Grafana integration via API
curl -X POST "http://hyperic-server:7080/hq/api/measurement" \
  -H "Authorization: Bearer $API_TOKEN" \
  -H "Content-Type: application/json" \
  -d '{"metric": "cpu.usage", "value": 75.2, "timestamp": 1724646600}'
Conclusion
Hyperic provides a comprehensive solution for Linux application performance monitoring, offering robust features for system administrators and DevOps teams. By implementing proper monitoring strategies, configuring appropriate alerts, and following best practices, you can ensure optimal performance and reliability of your Linux infrastructure.
The key to successful Hyperic deployment lies in understanding your monitoring requirements, properly configuring agents and servers, and maintaining the system through regular updates and optimizations. With its powerful features and flexibility, Hyperic remains an valuable tool for enterprise-level Linux monitoring solutions.
Related Posts
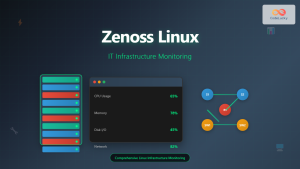
Zenoss Linux: Complete Guide to IT Infrastructure Monitoring and Management
What is Zenoss and Why Use it on Linux? Zenoss is a powerful, open-source IT infrastructure monitoring platform that provides...
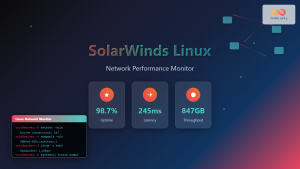
SolarWinds Linux: Complete Network Performance Monitor Guide for System Administrators
SolarWinds Network Performance Monitor (NPM) is a powerful network monitoring solution that provides comprehensive visibility into network infrastructure performance. While...
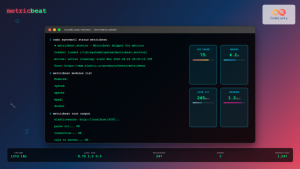
metricbeat Linux: Complete Guide to System and Service Metrics Monitoring
Metricbeat is a lightweight shipper that helps you monitor your systems and services by collecting metrics from the operating system...
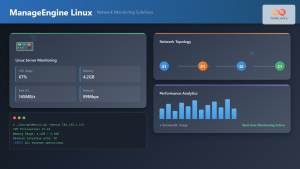
ManageEngine Linux: Complete Network Monitoring Solutions Guide
Network monitoring is crucial for maintaining optimal performance and security in Linux environments. ManageEngine provides powerful network monitoring solutions specifically...
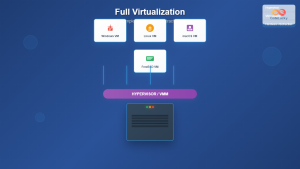
Full Virtualization: Complete Hardware Abstraction and Implementation Guide
Full virtualization represents one of the most significant breakthroughs in modern computing, enabling complete hardware abstraction that allows multiple operating...
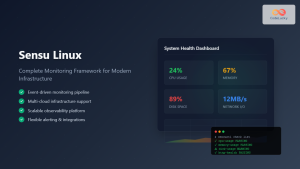
Sensu Linux: Complete Monitoring Framework Guide for System Administrators
Sensu is a powerful, open-source monitoring framework designed to monitor servers, services, application health, and business KPIs. Built with modern...
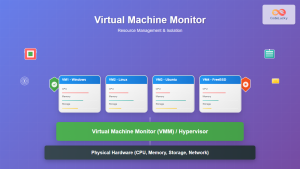
Virtual Machine Monitor: Complete Guide to Resource Management and Isolation
A Virtual Machine Monitor (VMM), also known as a hypervisor, is a critical software layer that creates and manages virtual...
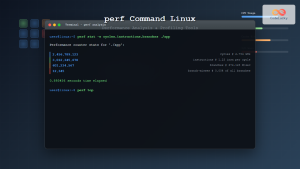
perf Command Linux: Complete Performance Analysis and Profiling Guide
The perf command is one of the most powerful performance analysis tools available in Linux, offering comprehensive insights into system...
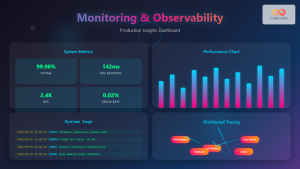
Monitoring and Observability: Complete Guide to Production System Insights and Performance Optimization
In today's fast-paced software development landscape, monitoring and observability have become critical pillars for maintaining robust production systems. As organizations...
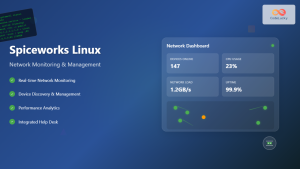
Spiceworks Linux: Complete Network Monitoring and Management Guide
Spiceworks is a powerful, free IT network monitoring and management platform that has revolutionized how system administrators handle their infrastructure....

Marathon Linux: Complete Guide to Container Orchestration Platform
Marathon is a powerful container orchestration platform built on top of Apache Mesos that enables you to deploy, manage, and...
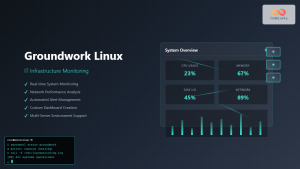
Groundwork Linux: Complete Guide to IT Infrastructure Monitoring and System Health Management
What is Groundwork Linux? Groundwork Linux is a comprehensive open-source IT infrastructure monitoring platform built specifically for Linux environments. It...


