What is Groundwork Linux?
Groundwork Linux is a comprehensive open-source IT infrastructure monitoring platform built specifically for Linux environments. It provides real-time monitoring, alerting, and reporting capabilities for servers, networks, applications, and services. Unlike traditional monitoring solutions, Groundwork Linux offers a unified approach to infrastructure management with powerful visualization tools and extensive customization options.
The platform combines the reliability of Linux with advanced monitoring frameworks like Nagios, Cacti, and NMAP to deliver enterprise-grade monitoring solutions. It’s particularly valuable for organizations managing complex IT infrastructures requiring 24/7 monitoring and rapid incident response.
Key Features and Benefits
Comprehensive Monitoring Capabilities
Groundwork Linux excels in monitoring various infrastructure components:
- Server Performance: CPU usage, memory consumption, disk space, and network throughput
- Network Health: Router status, switch performance, bandwidth utilization, and connectivity
- Application Monitoring: Web services, databases, custom applications, and API endpoints
- Environmental Factors: Temperature sensors, power consumption, and hardware health
Real-time Alerting System
The platform provides intelligent alerting mechanisms that notify administrators of critical issues before they impact business operations. Alerts can be delivered via email, SMS, SNMP traps, or custom notification methods.
Installation and Initial Setup
System Requirements
Before installing Groundwork Linux, ensure your system meets the minimum requirements:
# Check system specifications
uname -a
cat /proc/cpuinfo | grep processor | wc -l
free -h
df -h
Expected Output:
Linux monitoring-server 5.15.0-72-generic #79-Ubuntu SMP x86_64 GNU/Linux
4
              total        used        free      shared  buff/cache   available
Mem:           7.7Gi       2.1Gi       3.2Gi       345Mi       2.4Gi       5.1Gi
Filesystem      Size  Used Avail Use% Mounted on
/dev/sda1       98G   45G   48G  49% /
Installation Process
Follow these steps to install Groundwork Linux on your system:
Step 1: Update System Packages
# Update package repositories
sudo apt update && sudo apt upgrade -y

# Install essential dependencies
sudo apt install wget curl vim net-tools -y
Step 2: Download Groundwork Linux
# Create installation directory
mkdir -p ~/groundwork-install
cd ~/groundwork-install

# Download the latest Groundwork Linux package
wget https://groundwork.org/downloads/groundwork-monitor-professional.tar.gz

# Extract the package
tar -xzf groundwork-monitor-professional.tar.gz
Step 3: Run Installation Script
# Navigate to installation directory
cd groundwork-monitor-professional

# Make installation script executable
chmod +x install.sh

# Run installation with root privileges
sudo ./install.sh
The installation script will guide you through configuration options including database setup, web interface configuration, and initial administrative credentials.
Configuration and Setup
Database Configuration
Groundwork Linux requires a database backend for storing monitoring data. Configure PostgreSQL for optimal performance:
# Install PostgreSQL
sudo apt install postgresql postgresql-contrib -y

# Start and enable PostgreSQL service
sudo systemctl start postgresql
sudo systemctl enable postgresql

# Create Groundwork database
sudo -u postgres createdb groundwork
sudo -u postgres createuser groundwork_user

# Set database password
sudo -u postgres psql -c "ALTER USER groundwork_user PASSWORD 'secure_password';"
Web Interface Configuration
Configure the web interface for remote access and monitoring:
# Edit Apache configuration
sudo vim /etc/apache2/sites-available/groundwork.conf
Add the following configuration:
<VirtualHost *:80>
    ServerName monitoring.yourdomain.com
    DocumentRoot /usr/local/groundwork/apache2/htdocs

    <Directory "/usr/local/groundwork/apache2/htdocs">
        AllowOverride All
        Require all granted
    </Directory>

    ErrorLog /var/log/apache2/groundwork_error.log
    CustomLog /var/log/apache2/groundwork_access.log combined
</VirtualHost>
Enable the site and restart Apache:
# Enable the Groundwork site
sudo a2ensite groundwork.conf

# Enable required Apache modules
sudo a2enmod rewrite ssl

# Restart Apache service
sudo systemctl restart apache2
Basic Monitoring Configuration
Adding Host Monitoring
Configure basic host monitoring for Linux servers:
# Navigate to Groundwork configuration directory
cd /usr/local/groundwork/nagios/etc

# Create host definition file
sudo vim hosts/linux-servers.cfg
Add host definitions:
define host {
    use                     linux-server
    host_name              web-server-01
    alias                  Web Server 01
    address                192.168.1.100
    contact_groups         linux-admins
    notification_interval  30
    notification_period    24x7
}

define host {
    use                     linux-server
    host_name              db-server-01
    alias                  Database Server 01
    address                192.168.1.101
    contact_groups         linux-admins
    notification_interval  30
    notification_period    24x7
}
Service Monitoring Configuration
Set up service monitoring for critical applications:
# Create service definition file
sudo vim services/linux-services.cfg
Configure essential services:
# HTTP Service Monitoring
define service {
    use                     generic-service
    host_name              web-server-01
    service_description    HTTP Service
    check_command          check_http
    normal_check_interval  5
    retry_check_interval   1
}

# MySQL Database Monitoring
define service {
    use                     generic-service
    host_name              db-server-01
    service_description    MySQL Database
    check_command          check_mysql
    normal_check_interval  5
    retry_check_interval   1
}

# Disk Space Monitoring
define service {
    use                     generic-service
    host_name              web-server-01,db-server-01
    service_description    Root Partition
    check_command          check_nrpe!check_disk
    normal_check_interval  10
    retry_check_interval   2
}
Advanced Monitoring Techniques
Custom Plugin Development
Create custom monitoring plugins for specific requirements:
# Create custom plugin directory
sudo mkdir -p /usr/local/groundwork/nagios/libexec/custom

# Create a custom memory monitoring plugin
sudo vim /usr/local/groundwork/nagios/libexec/custom/check_memory_usage.sh
Plugin script content:
#!/bin/bash

# Custom Memory Usage Check Plugin
# Usage: check_memory_usage.sh -w 80 -c 90

while getopts "w:c:" opt; do
    case $opt in
        w) WARNING=$OPTARG;;
        c) CRITICAL=$OPTARG;;
    esac
done

# Get memory usage percentage
MEMORY_USAGE=$(free | grep Mem | awk '{printf "%.2f", $3/$2 * 100.0}')
MEMORY_USAGE_INT=${MEMORY_USAGE%.*}

if [ $MEMORY_USAGE_INT -ge $CRITICAL ]; then
    echo "CRITICAL - Memory usage is ${MEMORY_USAGE}%"
    exit 2
elif [ $MEMORY_USAGE_INT -ge $WARNING ]; then
    echo "WARNING - Memory usage is ${MEMORY_USAGE}%"
    exit 1
else
    echo "OK - Memory usage is ${MEMORY_USAGE}%"
    exit 0
fi
Make the plugin executable and test it:
# Make plugin executable
sudo chmod +x /usr/local/groundwork/nagios/libexec/custom/check_memory_usage.sh

# Test the plugin
/usr/local/groundwork/nagios/libexec/custom/check_memory_usage.sh -w 80 -c 90
Expected Output:
OK - Memory usage is 45.67%Network Monitoring Setup
Configure comprehensive network monitoring:
# Install SNMP utilities
sudo apt install snmp snmp-mibs-downloader -y

# Test SNMP connectivity
snmpwalk -v2c -c public 192.168.1.1 1.3.6.1.2.1.1.1.0
Configure switch and router monitoring:
# Add network device configuration
sudo vim /usr/local/groundwork/nagios/etc/hosts/network-devices.cfg
define host {
use switch
host_name core-switch-01
alias Core Network Switch
address 192.168.1.10
contact_groups network-admins
notification_interval 15
}
define service {
use generic-service
host_name core-switch-01
service_description Switch Port Status
check_command check_snmp_port_status
normal_check_interval 5
}Performance Monitoring and Optimization
System Performance Metrics
Monitor critical system performance indicators:
# CPU monitoring command
define command {
    command_name    check_cpu_usage
    command_line    $USER1$/check_nrpe -H $HOSTADDRESS$ -c check_cpu -a 80 90
}

# Memory monitoring command
define command {
    command_name    check_memory_usage
    command_line    $USER1$/custom/check_memory_usage.sh -w 85 -c 95
}

# Disk I/O monitoring
define command {
    command_name    check_disk_io
    command_line    $USER1$/check_nrpe -H $HOSTADDRESS$ -c check_iostat -a 80 90
}
Application Performance Monitoring
Set up application-specific monitoring:
# Web application response time
define service {
    use                     generic-service
    host_name              web-server-01
    service_description    Web App Response Time
    check_command          check_http_response_time!5!10
    normal_check_interval  2
}

# Database connection monitoring
define service {
    use                     generic-service
    host_name              db-server-01
    service_description    Database Connections
    check_command          check_mysql_connections!80!90
    normal_check_interval  5
}
Alerting and Notification Setup
Email Notification Configuration
Configure email alerts for critical events:
# Install mail utilities
sudo apt install mailutils postfix -y

# Configure email notifications
sudo vim /usr/local/groundwork/nagios/etc/objects/contacts.cfg
define contact {
contact_name admin
alias System Administrator
email [email protected]
host_notification_period 24x7
service_notification_period 24x7
host_notification_options d,u,r,f
service_notification_options w,u,c,r,f
host_notification_commands notify-host-by-email
service_notification_commands notify-service-by-email
}
define contactgroup {
contactgroup_name linux-admins
alias Linux Administrators
members admin
}SMS Alert Integration
Set up SMS notifications for critical alerts:
# Create SMS notification script
sudo vim /usr/local/groundwork/nagios/libexec/send_sms.sh
#!/bin/bash
# SMS Notification Script
PHONE_NUMBER=$1
MESSAGE=$2
# Using Twilio API (replace with your credentials)
curl -X POST "https://api.twilio.com/2010-04-01/Accounts/YOUR_ACCOUNT_SID/Messages.json" \
--data-urlencode "From=+1234567890" \
--data-urlencode "To=$PHONE_NUMBER" \
--data-urlencode "Body=$MESSAGE" \
-u YOUR_ACCOUNT_SID:YOUR_AUTH_TOKENDashboard and Reporting
Custom Dashboard Creation
Create customized monitoring dashboards:
# Access Groundwork web interface
# Navigate to: http://your-server-ip/groundwork

# Create dashboard configuration
sudo vim /usr/local/groundwork/config/dashboard.xml
<?xml version="1.0" encoding="UTF-8"?>
<dashboard>
<widget type="status-summary" position="top-left">
<title>System Status Overview</title>
<hosts>web-server-01,db-server-01</hosts>
</widget>
<widget type="performance-graph" position="top-right">
<title>CPU Usage Trend</title>
<metric>cpu_usage</metric>
<timeframe>24h</timeframe>
</widget>
<widget type="alert-list" position="bottom">
<title>Recent Alerts</title>
<count>10</count>
</widget>
</dashboard>Automated Reporting
Set up automated performance reports:
# Create report generation script
sudo vim /usr/local/groundwork/scripts/generate_weekly_report.sh
#!/bin/bash
# Weekly Performance Report Generator
REPORT_DATE=$(date +"%Y-%m-%d")
REPORT_FILE="/var/reports/weekly_report_$REPORT_DATE.html"
# Generate HTML report
cat << EOF > $REPORT_FILE
<html>
<head><title>Weekly Infrastructure Report - $REPORT_DATE</title></head>
<body>
<h1>Weekly Infrastructure Report</h1>
<h2>System Availability</h2>
$(mysql -u groundwork -p -e "SELECT host_name, ROUND(AVG(availability),2) as uptime FROM host_status WHERE date >= DATE_SUB(NOW(), INTERVAL 7 DAY) GROUP BY host_name;" groundwork_db)
<h2>Performance Metrics</h2>
$(mysql -u groundwork -p -e "SELECT service_description, ROUND(AVG(performance_data),2) as avg_performance FROM service_status WHERE date >= DATE_SUB(NOW(), INTERVAL 7 DAY) GROUP BY service_description;" groundwork_db)
</body>
</html>
EOF
# Email the report
mail -s "Weekly Infrastructure Report" -a "Content-Type: text/html" [email protected] < $REPORT_FILETroubleshooting Common Issues
Service Status Problems
Diagnose and resolve common monitoring issues:
# Check Nagios configuration syntax
sudo /usr/local/groundwork/nagios/bin/nagios -v /usr/local/groundwork/nagios/etc/nagios.cfg

# Restart Nagios service
sudo systemctl restart nagios

# Check service logs
sudo tail -f /usr/local/groundwork/nagios/var/nagios.log

# Verify plugin execution
sudo -u nagios /usr/local/groundwork/nagios/libexec/check_ping -H 192.168.1.100 -w 100,20% -c 500,60%
Database Connection Issues
Resolve database connectivity problems:
# Test database connection
psql -h localhost -U groundwork_user -d groundwork -c "SELECT version();"

# Check database logs
sudo tail -f /var/log/postgresql/postgresql-13-main.log

# Restart database service
sudo systemctl restart postgresql
Security Best Practices
Access Control Configuration
Implement proper security measures:
# Create monitoring user with limited privileges
sudo useradd -r -s /bin/false groundwork-monitor

# Set proper file permissions
sudo chown -R groundwork-monitor:groundwork-monitor /usr/local/groundwork/
sudo chmod 750 /usr/local/groundwork/nagios/etc/

# Configure firewall rules
sudo ufw allow from 192.168.1.0/24 to any port 80
sudo ufw allow from 192.168.1.0/24 to any port 443
sudo ufw enable
SSL Certificate Setup
Secure web interface with SSL:
# Generate SSL certificate
sudo openssl req -x509 -nodes -days 365 -newkey rsa:2048 \
  -keyout /etc/ssl/private/groundwork.key \
  -out /etc/ssl/certs/groundwork.crt

# Configure SSL virtual host
sudo vim /etc/apache2/sites-available/groundwork-ssl.conf
<VirtualHost *:443>
ServerName monitoring.yourdomain.com
DocumentRoot /usr/local/groundwork/apache2/htdocs
SSLEngine on
SSLCertificateFile /etc/ssl/certs/groundwork.crt
SSLCertificateKeyFile /etc/ssl/private/groundwork.key
<Directory "/usr/local/groundwork/apache2/htdocs">
AllowOverride All
Require all granted
</Directory>
</VirtualHost>Maintenance and Updates
Regular Maintenance Tasks
Perform regular maintenance to ensure optimal performance:
# Create maintenance script
sudo vim /usr/local/groundwork/scripts/maintenance.sh
#!/bin/bash
# Groundwork Maintenance Script
echo "Starting Groundwork maintenance..."
# Clean old log files
find /usr/local/groundwork/nagios/var/ -name "*.log" -mtime +30 -delete
# Archive old performance data
mysql -u groundwork -p -e "DELETE FROM performance_data WHERE date < DATE_SUB(NOW(), INTERVAL 90 DAY);" groundwork_db
# Update system packages
apt update && apt upgrade -y
# Restart services
systemctl restart nagios
systemctl restart apache2
echo "Maintenance completed successfully."Schedule the maintenance script:
# Add to crontab
sudo crontab -e

# Add the following line for weekly maintenance
0 2 * * 0 /usr/local/groundwork/scripts/maintenance.sh >> /var/log/groundwork-maintenance.log 2>&1
Conclusion
Groundwork Linux provides a robust foundation for comprehensive IT infrastructure monitoring. By implementing the configurations and techniques outlined in this guide, you can establish a reliable monitoring system that proactively identifies issues, maintains system health, and ensures optimal performance across your entire infrastructure.
The platform’s flexibility allows for extensive customization to meet specific organizational needs, while its integration capabilities enable seamless operation with existing tools and workflows. Regular maintenance and continuous optimization will ensure your monitoring system remains effective and valuable as your infrastructure evolves.
Remember to regularly review and update your monitoring configurations, test alert mechanisms, and train your team on proper incident response procedures to maximize the benefits of your Groundwork Linux implementation.
Related Posts
nagios Linux: Complete Infrastructure Monitoring System Setup Guide
Introduction to Nagios Nagios is one of the most popular open-source infrastructure monitoring systems available for Linux environments. Originally developed...
ganglia Linux: Complete Guide to Distributed Monitoring System
Ganglia is a powerful, open-source distributed monitoring system designed specifically for high-performance computing clusters, grids, and cloud infrastructures. Originally developed...
nagiosxi Linux: Complete Enterprise Network Monitoring Guide with Commands and Configuration
NagiosXI represents the pinnacle of enterprise network monitoring solutions on Linux systems, offering comprehensive infrastructure oversight with advanced alerting, reporting,...
ManageEngine Linux: Complete Network Monitoring Solutions Guide
Network monitoring is crucial for maintaining optimal performance and security in Linux environments. ManageEngine provides powerful network monitoring solutions specifically...
Spiceworks Linux: Complete Network Monitoring and Management Guide
Spiceworks is a powerful, free IT network monitoring and management platform that has revolutionized how system administrators handle their infrastructure....
centreon Linux: Complete IT Infrastructure Monitoring Solution Guide
Centreon is a powerful, open-source IT infrastructure monitoring platform built on top of Nagios Core. It provides a comprehensive web-based...
Zenoss Linux: Complete Guide to IT Infrastructure Monitoring and Management
What is Zenoss and Why Use it on Linux? Zenoss is a powerful, open-source IT infrastructure monitoring platform that provides...
op5 Linux: Complete Network Monitoring Solution Guide
op5 Linux is a comprehensive network monitoring solution built on top of the proven Nagios monitoring engine. This enterprise-grade platform...
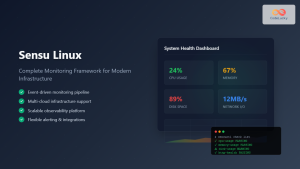
Sensu Linux: Complete Monitoring Framework Guide for System Administrators
Sensu is a powerful, open-source monitoring framework designed to monitor servers, services, application health, and business KPIs. Built with modern...
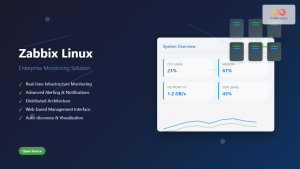
Zabbix Linux: Complete Enterprise Monitoring Solution for System Administrators
Zabbix stands as one of the most powerful and comprehensive open-source monitoring solutions available for Linux environments. This enterprise-grade monitoring...
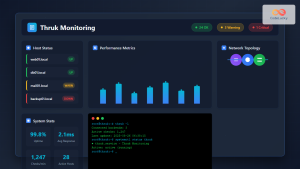
thruk Linux: Comprehensive Monitoring Web Interface for Network Infrastructure
Thruk is a powerful web-based monitoring interface designed primarily for Nagios and compatible monitoring systems. As a comprehensive frontend solution,...
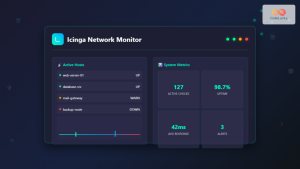
icinga Linux: Complete Network Monitoring System Guide for System Administrators
Icinga is a powerful open-source network monitoring system that helps system administrators monitor network resources, notify users of outages, and...