
Ganglia is a powerful, open-source distributed monitoring system designed specifically for high-performance computing clusters, grids, and cloud infrastructures. Originally developed at the University of California, Berkeley, Ganglia provides real-time monitoring capabilities for thousands of nodes with minimal overhead, making it an essential tool for system administrators managing large-scale Linux environments.
What is Ganglia Linux Monitoring?
Ganglia operates as a scalable distributed monitoring system that collects, aggregates, and visualizes system metrics across multiple nodes in a network. Unlike traditional monitoring solutions, Ganglia uses a hierarchical design with three main components:
- gmond (Ganglia Monitoring Daemon) – Collects system metrics on each monitored node
- gmetad (Ganglia Meta Daemon) – Aggregates data from multiple clusters
- gweb (Ganglia Web Interface) – Provides web-based visualization and reporting
Key Features and Benefits
Ganglia offers several advantages that make it particularly suitable for Linux cluster environments:
Scalability and Performance
- Monitors thousands of nodes with minimal resource consumption
- Uses multicast communication to reduce network overhead
- Hierarchical data aggregation for efficient large-scale monitoring
- Self-healing network topology
Comprehensive Metrics Collection
- CPU utilization, load averages, and process statistics
- Memory usage, swap utilization, and buffer statistics
- Network interface statistics and disk I/O metrics
- Custom metrics through extensible plugin architecture
Installing Ganglia on Linux Systems
The installation process varies depending on your Linux distribution. Here are the most common installation methods:
Ubuntu/Debian Installation
# Update package repositories
sudo apt update

# Install Ganglia components
sudo apt install ganglia-monitor ganglia-webfrontend gmetad

# Install additional dependencies
sudo apt install rrdtool apache2 php libapache2-mod-php
CentOS/RHEL Installation
# Enable EPEL repository
sudo yum install epel-release

# Install Ganglia packages
sudo yum install ganglia ganglia-gmond ganglia-gmetad ganglia-web

# Install web server and PHP
sudo yum install httpd php
Fedora Installation
# Install Ganglia components
sudo dnf install ganglia ganglia-gmond ganglia-gmetad ganglia-web

# Install Apache and PHP
sudo dnf install httpd php
Configuring Ganglia Components
Configuring gmond (Monitoring Daemon)
The gmond daemon runs on each node you want to monitor. Its configuration file is typically located at /etc/ganglia/gmond.conf:
# Basic gmond configuration
globals {
  daemonize = yes
  setuid = yes
  user = ganglia
  debug_level = 0
  max_udp_msg_len = 1472
  mute = no
  deaf = no
  allow_extra_data = yes
  host_dmax = 86400
  cleanup_threshold = 300
  gexec = no
  send_metadata_interval = 30
  module_dir = /usr/lib64/ganglia
}

cluster {
  name = "my_cluster"
  owner = "admin"
  latlong = "N40.87 W74.20"
  url = "http://cluster.example.com"
}

host {
  location = "rack1,cabinet1"
}

# Multicast configuration
udp_send_channel {
  mcast_join = 239.2.11.71
  port = 8649
  ttl = 1
}

udp_recv_channel {
  mcast_join = 239.2.11.71
  port = 8649
  bind = 239.2.11.71
  retry_bind = true
}

# Unicast configuration (alternative to multicast)
# udp_send_channel {
#   host = ganglia-server.example.com
#   port = 8649
# }

tcp_accept_channel {
  port = 8649
}
Configuring gmetad (Meta Daemon)
The gmetad daemon aggregates data from multiple clusters. Configure it in /etc/ganglia/gmetad.conf:
# Basic gmetad configuration
data_source "my_cluster" localhost

# Multiple cluster configuration
# data_source "cluster1" node1.example.com node2.example.com
# data_source "cluster2" 192.168.1.10:8649 192.168.1.11:8649

# RRD storage location
rrd_rootdir "/var/lib/ganglia/rrds"

# Metadata refresh interval
xml_port 8651
interactive_port 8652

# Server threads
server_threads 4

# Case sensitive hostnames
case_sensitive_hostnames 0

# Cleanup old metrics
cleanup_interval 300
Web Interface Configuration
Configure the Ganglia web interface by setting up Apache virtual host or directory configuration:
Apache Configuration
# /etc/apache2/conf-available/ganglia.conf (Ubuntu/Debian)
# or /etc/httpd/conf.d/ganglia.conf (CentOS/RHEL)

Alias /ganglia /usr/share/ganglia-webfrontend

<Directory "/usr/share/ganglia-webfrontend">
  Options Indexes FollowSymLinks MultiViews
  AllowOverride None
  Order allow,deny
  Allow from all
  # Restrict access to specific networks
  # Allow from 192.168.1.0/24
</Directory>
PHP Configuration
Ensure PHP is properly configured for Ganglia web interface:
# Check PHP configuration
php -m | grep -E "(xml|gd|json)"

# Install missing PHP modules if needed
sudo apt install php-xml php-gd php-json  # Ubuntu/Debian
sudo yum install php-xml php-gd php-json  # CentOS/RHEL
Starting Ganglia Services
Start and enable Ganglia services using systemctl:
# Start gmond on monitoring nodes
sudo systemctl start ganglia-monitor
sudo systemctl enable ganglia-monitor

# Start gmetad on aggregation server
sudo systemctl start gmetad
sudo systemctl enable gmetad

# Start Apache web server
sudo systemctl start apache2    # Ubuntu/Debian
sudo systemctl start httpd      # CentOS/RHEL
sudo systemctl enable apache2   # Ubuntu/Debian
sudo systemctl enable httpd     # CentOS/RHEL

# Verify services are running
sudo systemctl status ganglia-monitor
sudo systemctl status gmetad
sudo systemctl status apache2   # or httpd
Practical Configuration Examples
Multi-Cluster Setup
For environments with multiple clusters, configure gmetad to collect from different sources:
# /etc/ganglia/gmetad.conf
data_source "web_servers" web1.example.com web2.example.com web3.example.com
data_source "database_servers" db1.example.com:8649 db2.example.com:8649
data_source "compute_cluster" 10.0.1.100 10.0.1.101 10.0.1.102

# Set different polling intervals
data_source "critical_systems" 15 critical1.example.com critical2.example.com
data_source "development" 60 dev1.example.com dev2.example.com

rrd_rootdir "/var/lib/ganglia/rrds"
xml_port 8651
interactive_port 8652
Security Configuration
Implement security measures for production deployments:
# Restrict web interface access
<Directory "/usr/share/ganglia-webfrontend">
  AuthType Basic
  AuthName "Ganglia Monitoring"
  AuthUserFile /etc/ganglia/.htpasswd
  Require valid-user

  # IP-based restrictions
  <RequireAll>
    Require ip 192.168.1.0/24
    Require ip 10.0.0.0/8
  </RequireAll>
</Directory>

# Create password file
sudo htpasswd -c /etc/ganglia/.htpasswd admin
Custom Metrics and Plugins
Ganglia supports custom metrics through Python, C, or shell script modules:
Python Module Example
# /usr/lib64/ganglia/python_modules/disk_usage.py
import os

def disk_usage_handler(name):
    """Custom disk usage metric"""
    if name == 'disk_usage_root':
        statvfs = os.statvfs('/')
        total_space = statvfs.f_frsize * statvfs.f_blocks
        free_space = statvfs.f_frsize * statvfs.f_available
        used_percentage = ((total_space - free_space) * 100) // total_space
        return used_percentage
    return 0

def metric_init(params):
    """Initialize custom metrics"""
    descriptors = []

    d = {
        'name': 'disk_usage_root',
        'call_back': disk_usage_handler,
        'time_max': 90,
        'value_type': 'uint',
        'units': '%',
        'slope': 'both',
        'format': '%u',
        'description': 'Root filesystem usage percentage',
        'groups': 'disk'
    }

    descriptors.append(d)
    return descriptors

def metric_cleanup():
    """Cleanup function"""
    pass
Module Configuration
Add the Python module to gmond configuration:
# Add to /etc/ganglia/gmond.conf
modules {
  module {
    name = "python_module"
    path = "/usr/lib64/ganglia/modpython.so"
    params = "/usr/lib64/ganglia/python_modules"
  }
}

include ('/etc/ganglia/conf.d/*.conf')
# /etc/ganglia/conf.d/disk_usage.conf
python {
  module disk_usage {
    param refresh_rate {
      value = 30
    }
  }
}
Troubleshooting Common Issues
Network Connectivity Problems
# Check if gmond is listening
sudo netstat -tulpn | grep :8649

# Test multicast connectivity
# On sender node
gmetric --name="test_metric" --value="100" --type="uint16"

# On receiver node
telnet localhost 8649

# Check firewall rules
sudo iptables -L | grep 8649
sudo firewall-cmd --list-ports  # For firewalld
Data Collection Issues
# Verify gmond is collecting data
sudo gmond --debug=3

# Check RRD files creation
ls -la /var/lib/ganglia/rrds/

# Test gmetad connectivity
telnet localhost 8651

# Check logs for errors
sudo journalctl -u ganglia-monitor
sudo journalctl -u gmetad
tail -f /var/log/apache2/error.log
Web Interface Problems
# Verify PHP configuration
php -i | grep -i ganglia

# Check Apache error logs
tail -f /var/log/apache2/error.log

# Test PHP functionality
php -r "echo 'PHP is working';"

# Verify file permissions
sudo chown -R www-data:www-data /var/lib/ganglia/rrds/
sudo chmod -R 755 /usr/share/ganglia-webfrontend/
Performance Optimization
Tuning gmond Performance
# Optimize gmond configuration for large clusters
globals {
  max_udp_msg_len = 1472
  cleanup_threshold = 300
  host_dmax = 86400
  send_metadata_interval = 300  # Increase for large clusters
}

# Reduce metric collection frequency for non-critical metrics
collection_group {
  collect_once = yes
  time_threshold = 1200
  metric {
    name = "boottime"
  }
}
RRD Storage Optimization
# Configure RRD storage retention
# /etc/ganglia/gmetad.conf
rrd_rootdir "/var/lib/ganglia/rrds"

# Create custom RRD archives for different retention periods
RRAs "RRA:AVERAGE:0.5:1:5760" "RRA:AVERAGE:0.5:4:20160" "RRA:AVERAGE:0.5:40:52704"

# Optimize disk I/O
# Mount RRD directory with optimized options
# /dev/sdb1 /var/lib/ganglia/rrds ext4 noatime,data=writeback 0 0
Integration with Other Tools
Nagios Integration
# Use Ganglia data in Nagios checks
#!/bin/bash
# check_ganglia_metric.sh
METRIC_NAME=$1
WARNING_THRESHOLD=$2
CRITICAL_THRESHOLD=$3

METRIC_VALUE=$(gmetric --list | grep $METRIC_NAME | awk '{print $3}')

if (( $(echo "$METRIC_VALUE > $CRITICAL_THRESHOLD" | bc -l) )); then
    echo "CRITICAL: $METRIC_NAME is $METRIC_VALUE"
    exit 2
elif (( $(echo "$METRIC_VALUE > $WARNING_THRESHOLD" | bc -l) )); then
    echo "WARNING: $METRIC_NAME is $METRIC_VALUE"
    exit 1
else
    echo "OK: $METRIC_NAME is $METRIC_VALUE"
    exit 0
fi
Grafana Integration
Configure Grafana to use Ganglia as a data source for advanced visualization:
# Install Grafana Ganglia plugin
grafana-cli plugins install ganglia-datasource

# Configure data source in Grafana
{
  "type": "ganglia",
  "url": "http://ganglia-server:8651",
  "access": "proxy",
  "isDefault": false
}
Best Practices and Recommendations
Deployment Strategy
- Start Small: Begin with a pilot deployment on a subset of nodes
- Network Planning: Use unicast in environments where multicast is problematic
- Hierarchical Design: Implement multiple gmetad instances for large deployments
- Security First: Always implement authentication and network restrictions
Monitoring Best Practices
- Baseline Establishment: Collect historical data to establish performance baselines
- Alert Thresholds: Set meaningful alert thresholds based on historical data
- Custom Metrics: Develop application-specific metrics for comprehensive monitoring
- Regular Maintenance: Implement log rotation and RRD cleanup procedures
Conclusion
Ganglia provides a robust, scalable solution for monitoring Linux clusters and distributed systems. Its lightweight design, comprehensive metric collection, and web-based visualization make it an excellent choice for system administrators managing large-scale infrastructure. By following the configuration examples and best practices outlined in this guide, you can successfully deploy and maintain a Ganglia monitoring system that provides valuable insights into your infrastructure’s performance and health.
The key to successful Ganglia implementation lies in proper planning, incremental deployment, and ongoing optimization. Start with basic monitoring capabilities and gradually expand to include custom metrics and advanced features as your monitoring requirements evolve. With proper configuration and maintenance, Ganglia can serve as the foundation of your infrastructure monitoring strategy for years to come.
Related Posts
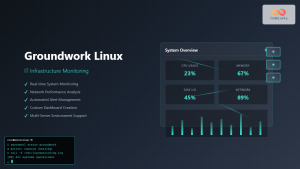
Groundwork Linux: Complete Guide to IT Infrastructure Monitoring and System Health Management
What is Groundwork Linux? Groundwork Linux is a comprehensive open-source IT infrastructure monitoring platform built specifically for Linux environments. It...
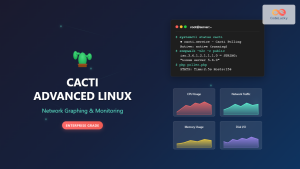
Cacti Advanced Linux: Complete Guide to Enterprise Network Graphing and Monitoring
Cacti stands as one of the most powerful open-source network graphing solutions available for Linux systems, providing comprehensive network monitoring...

mesos Linux: Complete Guide to Distributed Systems Kernel and Cluster Management
Apache Mesos is a powerful distributed systems kernel that abstracts CPU, memory, storage, and other compute resources across machines, enabling...
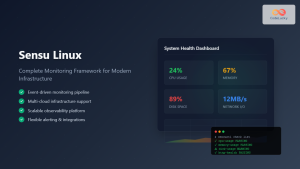
Sensu Linux: Complete Monitoring Framework Guide for System Administrators
Sensu is a powerful, open-source monitoring framework designed to monitor servers, services, application health, and business KPIs. Built with modern...
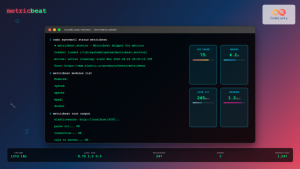
metricbeat Linux: Complete Guide to System and Service Metrics Monitoring
Metricbeat is a lightweight shipper that helps you monitor your systems and services by collecting metrics from the operating system...
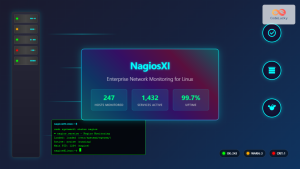
nagiosxi Linux: Complete Enterprise Network Monitoring Guide with Commands and Configuration
NagiosXI represents the pinnacle of enterprise network monitoring solutions on Linux systems, offering comprehensive infrastructure oversight with advanced alerting, reporting,...

Cacti Linux: Complete Network Monitoring and Graphing Solution
Cacti is a comprehensive network graphing solution designed to harness the power of RRDtool's data storage and graphing functionality. Built...
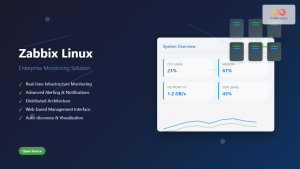
Zabbix Linux: Complete Enterprise Monitoring Solution for System Administrators
Zabbix stands as one of the most powerful and comprehensive open-source monitoring solutions available for Linux environments. This enterprise-grade monitoring...
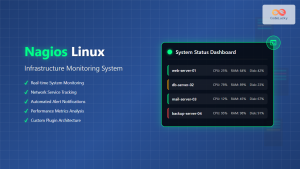
nagios Linux: Complete Infrastructure Monitoring System Setup Guide
Introduction to Nagios Nagios is one of the most popular open-source infrastructure monitoring systems available for Linux environments. Originally developed...
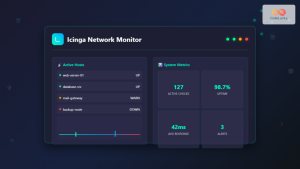
icinga Linux: Complete Network Monitoring System Guide for System Administrators
Icinga is a powerful open-source network monitoring system that helps system administrators monitor network resources, notify users of outages, and...
Spiceworks Linux: Complete Network Monitoring and Management Guide
Spiceworks is a powerful, free IT network monitoring and management platform that has revolutionized how system administrators handle their infrastructure....
ManageEngine Linux: Complete Network Monitoring Solutions Guide
Network monitoring is crucial for maintaining optimal performance and security in Linux environments. ManageEngine provides powerful network monitoring solutions specifically...


