
What is the Excel QUARTILE Function?
The Excel QUARTILE function is a powerful statistical tool that divides a dataset into four equal parts, helping you identify key data distribution points. This function calculates the values at the 25th, 50th, and 75th percentiles of your data, making it essential for statistical analysis, data interpretation, and business intelligence.
Understanding quartiles is crucial for analyzing data spread, identifying outliers, and making informed decisions based on statistical distributions. Whether you’re analyzing sales performance, student grades, or financial metrics, the QUARTILE function provides valuable insights into your data’s structure.
QUARTILE Function Syntax and Parameters
The basic syntax for the QUARTILE function follows this structure:
=QUARTILE(array, quart)Parameters Breakdown
- array (required): The range of cells or array containing numeric values you want to analyze
- quart (required): An integer from 0 to 4 specifying which quartile to return
Quartile Values Explained
| Quart Value | Statistical Term | Description | Percentile |
|---|---|---|---|
| 0 | Minimum | Smallest value in dataset | 0th percentile |
| 1 | First Quartile (Q1) | 25% of data falls below this value | 25th percentile |
| 2 | Second Quartile (Q2) | Median – 50% of data falls below | 50th percentile |
| 3 | Third Quartile (Q3) | 75% of data falls below this value | 75th percentile |
| 4 | Maximum | Largest value in dataset | 100th percentile |
Practical Examples and Applications
Basic QUARTILE Function Examples
Let’s work with a sample dataset of test scores: 65, 70, 75, 80, 85, 90, 95, 100. Here’s how to apply different quartile calculations:
=QUARTILE(A1:A8, 0)    // Returns 65 (minimum value)
=QUARTILE(A1:A8, 1)    // Returns 73.75 (Q1)
=QUARTILE(A1:A8, 2)    // Returns 82.5 (median)
=QUARTILE(A1:A8, 3)    // Returns 91.25 (Q3)
=QUARTILE(A1:A8, 4)    // Returns 100 (maximum value)
Sales Performance Analysis
Consider analyzing monthly sales data across different regions. Using quartiles helps identify top performers, average performers, and regions needing improvement:
=QUARTILE(B2:B13, 1)    // Bottom 25% threshold
=QUARTILE(B2:B13, 2)    // Median performance
=QUARTILE(B2:B13, 3)    // Top 25% threshold
Advanced QUARTILE Techniques
Combining QUARTILE with Other Functions
The QUARTILE function becomes more powerful when combined with other Excel functions for comprehensive analysis:
=IF(A2>QUARTILE($A$2:$A$100,3),"Top Quartile","Lower Quartiles")This formula categorizes values based on quartile thresholds, useful for performance rankings and data classification.
Dynamic Quartile Analysis
Create dynamic dashboards using QUARTILE with data validation lists:
=QUARTILE(DataRange, E1)Where E1 contains a dropdown list with values 0-4, allowing users to interactively explore different quartiles.
QUARTILE vs QUARTILE.INC vs QUARTILE.EXC
Excel offers three quartile functions with subtle differences:
QUARTILE (Legacy Function)
The original QUARTILE function uses the inclusive method, equivalent to QUARTILE.INC. It’s maintained for backward compatibility but QUARTILE.INC is recommended for new workbooks.
QUARTILE.INC (Inclusive Method)
Uses the inclusive method where quartiles include the actual data points in calculations. This is the most commonly used approach and matches the original QUARTILE function behavior.
QUARTILE.EXC (Exclusive Method)
Uses the exclusive method where quartiles are calculated between data points rather than including them. This method requires at least 4 data points and may produce different results for small datasets.
Common Use Cases and Business Applications
Financial Analysis
Investment portfolios benefit from quartile analysis to understand return distributions, risk assessment, and performance benchmarking against market indices.
Human Resources
Salary analysis using quartiles helps establish competitive compensation ranges, identify pay equity issues, and structure performance-based bonuses.
Quality Control
Manufacturing processes use quartile analysis to monitor product specifications, identify process variations, and maintain quality standards within acceptable ranges.
Academic Assessment
Educational institutions apply quartiles to grade distributions, standardized test scores, and student performance rankings across different subjects and time periods.
Troubleshooting Common QUARTILE Errors
#NUM! Error
This error occurs when the quart parameter is outside the valid range (0-4). Ensure your quartile specification uses only integers from 0 to 4.
#VALUE! Error
Appears when the array contains non-numeric values or text. Clean your data by removing or converting text entries to numbers before applying QUARTILE.
Empty Results
If QUARTILE returns blank results, check that your array reference contains actual data and not empty cells. Use filtering or data validation to ensure data quality.
Best Practices for QUARTILE Implementation
Data Preparation
Always clean your dataset before applying QUARTILE functions. Remove duplicates, handle missing values appropriately, and ensure consistent data types throughout your range.
Sample Size Considerations
Quartiles work best with larger datasets (n > 20). For smaller samples, consider whether quartile analysis provides meaningful insights or if alternative statistical measures might be more appropriate.
Visualization Integration
Combine QUARTILE results with Excel’s charting capabilities to create box plots, quartile bands, and other visual representations that make statistical insights more accessible to stakeholders.
Performance Optimization Tips
Array References
Use absolute references ($A$1:$A$100) when copying QUARTILE formulas across multiple cells to maintain consistent data ranges and avoid calculation errors.
Named Ranges
Create named ranges for frequently analyzed datasets to make formulas more readable and easier to maintain:
=QUARTILE(SalesData, 2) // Much clearer than =QUARTILE(B2:B150, 2)Calculation Settings
For large datasets, consider setting Excel to manual calculation mode during data entry and formula construction, then switch to automatic when analysis is complete.
Integration with Statistical Analysis
Interquartile Range (IQR)
Calculate the IQR to measure data spread and identify outliers:
=QUARTILE(A1:A100, 3) - QUARTILE(A1:A100, 1)Outlier Detection
Use quartiles to identify potential outliers using the 1.5×IQR rule:
=IF(OR(A2QUARTILE($A$2:$A$100,3)+1.5*(QUARTILE($A$2:$A$100,3)-QUARTILE($A$2:$A$100,1))),"Outlier","Normal") Conclusion
The Excel QUARTILE function is an indispensable tool for statistical analysis and data interpretation. By mastering its syntax, understanding different quartile types, and applying best practices, you can unlock powerful insights from your datasets. Whether analyzing business performance, conducting research, or making data-driven decisions, quartiles provide the foundation for understanding data distribution and variability.
Remember to combine QUARTILE with other Excel functions and visualization tools to create comprehensive analytical solutions that effectively communicate statistical insights to your audience. Regular practice with real-world datasets will enhance your proficiency and confidence in applying quartile analysis across various domains.
Related Posts
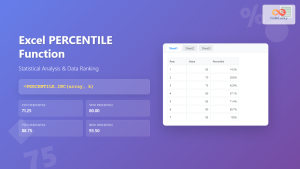
Excel PERCENTILE Function: Complete Guide to Statistical Analysis and Ranking
The Excel PERCENTILE function is a powerful statistical tool that helps you analyze data distribution and identify specific values within...

Excel AVERAGEIF Function: Complete Guide to Conditional Average Formulas
What is the Excel AVERAGEIF Function? The AVERAGEIF function is one of Excel's most powerful statistical tools that calculates the...
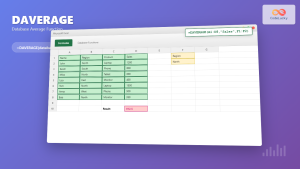
Excel DAVERAGE Function: Complete Guide to Database Average Calculations
The DAVERAGE function in Microsoft Excel is a powerful database function that calculates the average of values in a database...

Excel MEDIAN Function: Complete Guide to Middle Value Calculations
The MEDIAN function in Microsoft Excel is one of the most essential statistical functions for data analysis. It calculates the...

Excel CEILING Function: Complete Guide to Rounding Up Numbers
The Excel CEILING function is a powerful mathematical tool that rounds numbers up to the nearest specified multiple. Whether you're...
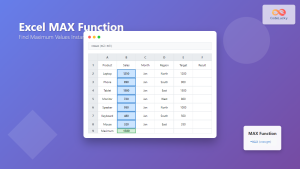
Excel MAX Function: Complete Guide to Finding Maximum Values in Spreadsheets
The MAX function in Microsoft Excel is one of the most fundamental and widely-used statistical functions that helps you quickly...

Excel FV Function: Complete Guide to Future Value Calculations
The Excel FV (Future Value) function is a powerful financial tool that calculates the future value of an investment based...
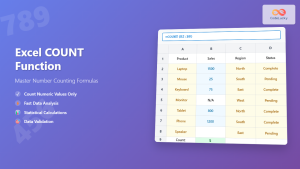
Excel COUNT Function: Complete Guide to Number Counting Formulas
The COUNT function is one of Excel's most fundamental and frequently used statistical functions. Whether you're analyzing sales data, tracking...
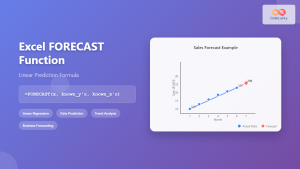
Excel FORECAST Function: Complete Guide to Linear Prediction Formula
The Excel FORECAST function is a powerful statistical tool that enables users to predict future values based on existing linear...
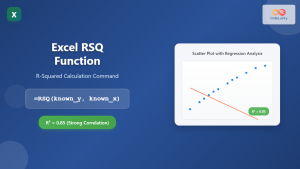
Excel RSQ Function: Complete Guide to R-Squared Calculations in Excel
What is the Excel RSQ Function? The RSQ function in Microsoft Excel calculates the square of the Pearson product-moment correlation...
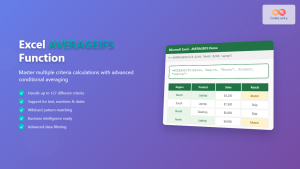
Excel AVERAGEIFS Function: Master Multiple Criteria Calculations
The AVERAGEIFS function in Microsoft Excel is a powerful statistical tool that enables users to calculate the average of cells...
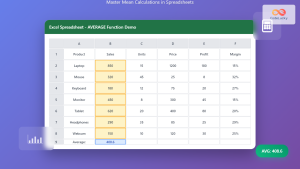
Excel AVERAGE Function: Complete Guide to Mean Calculation with Syntax Examples
The Excel AVERAGE function is one of the most fundamental and widely-used statistical functions in Microsoft Excel. This powerful function...


