
The dmesg command is one of the most powerful diagnostic tools in Linux, providing administrators and users with direct access to kernel ring buffer messages. These messages contain crucial information about hardware detection, driver loading, system errors, and boot processes that are essential for system troubleshooting and monitoring.
What is the dmesg Command?
The dmesg (display message or driver message) command displays messages from the kernel ring buffer, a data structure that stores kernel messages. This buffer has a fixed size and operates on a first-in-first-out basis, meaning older messages are overwritten by newer ones when the buffer becomes full.
Kernel messages include:
- Hardware detection and initialization
- Device driver loading and errors
- System boot messages
- Hardware failures and warnings
- Network interface status changes
- File system mount/unmount operations
- Security-related events
Basic dmesg Syntax
The basic syntax of the dmesg command is:
dmesg [OPTIONS]When executed without any options, dmesg displays all messages currently stored in the kernel ring buffer.
Simple dmesg Output Example
$ dmesg
[    0.000000] Linux version 5.15.0-56-generic (buildd@ubuntu) (gcc (Ubuntu 11.3.0-1ubuntu1~22.04) 11.3.0, GNU ld (GNU Binutils for Ubuntu) 2.38) #62-Ubuntu SMP Tue Nov 22 19:54:14 UTC 2022 (Ubuntu 5.15.0-56.62-generic 5.15.74)
[    0.000000] Command line: BOOT_IMAGE=/boot/vmlinuz-5.15.0-56-generic root=UUID=12345678-1234-1234-1234-123456789abc ro quiet splash
[    0.000000] KERNEL supported cpus:
[    0.000000]   Intel GenuineIntel
[    0.000000]   AMD AuthenticAMD
[    0.000000]   Hygon HygonGenuine
[    0.000000]   Centaur CentaurHauls
[    0.000000]   zhaoxin   Shanghai
[    0.001000] DMI: Dell Inc. OptiPlex 7090/0M3F6C, BIOS 1.4.0 09/03/2021
[    0.001200] tsc: Detected 2900.000 MHz processor
[    0.001500] e820: BIOS-provided physical RAM map:
Understanding dmesg Message Format
Each dmesg message follows a specific format:
[timestamp] subsystem: messageThe timestamp shows seconds since kernel boot, and messages are categorized by log levels:
| Level | Priority | Description |
|---|---|---|
| 0 | KERN_EMERG | Emergency – system is unusable |
| 1 | KERN_ALERT | Alert – action must be taken immediately |
| 2 | KERN_CRIT | Critical conditions |
| 3 | KERN_ERR | Error conditions |
| 4 | KERN_WARNING | Warning conditions |
| 5 | KERN_NOTICE | Normal but significant condition |
| 6 | KERN_INFO | Informational messages |
| 7 | KERN_DEBUG | Debug-level messages |
Essential dmesg Command Options
1. Display Human-Readable Timestamps (-T)
Convert kernel timestamps to human-readable format:
$ dmesg -T
[Mon Aug 25 06:02:15 2025] Linux version 5.15.0-56-generic
[Mon Aug 25 06:02:15 2025] Command line: BOOT_IMAGE=/boot/vmlinuz-5.15.0-56-generic
[Mon Aug 25 06:02:15 2025] KERNEL supported cpus:
[Mon Aug 25 06:02:15 2025] DMI: Dell Inc. OptiPlex 7090/0M3F6C, BIOS 1.4.0
2. Filter by Log Level (-l)
Display only messages of specific priority levels:
# Show only error messages (level 3 and below)
$ dmesg -l err
[    2.456789] ACPI Error: No handler for Region [ECDT] (00000000abcd1234) [EmbeddedControl] (20210730/evregion-130)
[   15.234567] ata1.00: exception Emask 0x0 SAct 0x0 SErr 0x0 action 0x0

# Show warnings and errors
$ dmesg -l warn,err
[    1.234567] ACPI Warning: SystemIO range 0x0000000000001828-0x000000000000182F conflicts with OpRegion 0x0000000000001800-0x000000000000187F (\PMIO) (20210730/utaddress-204)
[    2.456789] ACPI Error: No handler for Region [ECDT] (00000000abcd1234) [EmbeddedControl] (20210730/evregion-130)
3. Filter by Facility (-f)
Display messages from specific kernel facilities:
# Show kernel messages
$ dmesg -f kern
[    0.000000] Linux version 5.15.0-56-generic
[    0.000000] Command line: BOOT_IMAGE=/boot/vmlinuz

# Show daemon messages
$ dmesg -f daemon
[   45.678901] systemd[1]: Starting Network Manager...
[   45.789012] NetworkManager[1234]:  NetworkManager (version 1.36.6) is starting...
4. Follow New Messages (-w)
Monitor kernel messages in real-time:
$ dmesg -w
[12345.678901] usb 2-1: new full-speed USB device number 3 using uhci_hcd
[12345.789012] usb 2-1: New USB device found, idVendor=046d, idProduct=c077
[12345.890123] usb 2-1: New USB device strings: Mfr=1, Product=2, SerialNumber=0
[12345.901234] input: Logitech USB Optical Mouse as /devices/pci0000:00/0000:00:1d.0/usb2/2-1/2-1:1.0/0003:046D:C077.0003/input/input3
5. Clear Ring Buffer (-c)
Clear the kernel ring buffer (requires root privileges):
$ sudo dmesg -c
# This displays all messages then clears the buffer
6. Control Output Size (-n)
Set console log level:
# Set console log level to show only critical messages
$ sudo dmesg -n 2
Advanced dmesg Usage Examples
Combining Multiple Options
# Show last 20 error messages with human-readable timestamps
$ dmesg -T -l err | tail -20

# Monitor only USB-related messages
$ dmesg -w | grep -i usb

# Show kernel messages from last boot with colors
$ dmesg -T --color=always -f kern
Analyzing Boot Process
To examine the boot process:
$ dmesg | head -50
[    0.000000] Linux version 5.15.0-56-generic (buildd@ubuntu)
[    0.000000] Command line: BOOT_IMAGE=/boot/vmlinuz-5.15.0-56-generic root=UUID=12345678-1234-1234-1234-123456789abc ro quiet splash
[    0.000000] KERNEL supported cpus:
[    0.000000] e820: BIOS-provided physical RAM map:
[    0.000000] e820: [mem 0x0000000000000000-0x000000000009fbff] usable
[    0.000000] e820: [mem 0x000000000009fc00-0x000000000009ffff] reserved
[    0.000000] e820: [mem 0x00000000000f0000-0x00000000000fffff] reserved
[    0.000000] e820: [mem 0x0000000000100000-0x000000007ffeffff] usable
Hardware Detection Analysis
# Check CPU information
$ dmesg | grep -i cpu
[    0.000000] KERNEL supported cpus:
[    0.036000] smpboot: CPU0: Intel(R) Core(TM) i7-10700 CPU @ 2.90GHz (family: 0x6, model: 0xa5, stepping: 0x3)
[    0.036001] Performance Events: PEBS fmt3+, Skylake events, 32-deep LBR, full-width counters, Intel PMU driver.

# Check memory information
$ dmesg | grep -i memory
[    0.000000] Memory: 16777216K/16777216K available (14339K kernel code, 2346K rwdata, 4352K rodata, 2724K init, 2648K bss, 524288K reserved, 0K cma-reserved)

# Check storage devices
$ dmesg | grep -i "sd\|ata\|nvme"
[    2.345678] ata1: SATA max UDMA/133 abar m2048@0xfe900000 port 0xfe900100 irq 25
[    2.456789] ata1: SATA link up 6.0 Gbps (SStatus 133 SControl 300)
[    2.567890] ata1.00: ATA-10: ST1000DM010-2EP102, CC43, max UDMA/133
Filtering and Searching dmesg Output
Using grep for Specific Information
# Find USB device connections
$ dmesg | grep -i "usb.*connect"
[12345.123456] usb 1-1: new high-speed USB device number 2 using ehci-pci
[12346.234567] usb 1-1: USB disconnect, address 2

# Find network interface messages
$ dmesg | grep -E "(eth|wlan|enp)"
[   15.123456] e1000e 0000:00:19.0 eth0: registered PHC clock
[   15.234567] e1000e 0000:00:19.0 enp0s25: renamed from eth0

# Find filesystem mount/unmount operations
$ dmesg | grep -E "(mount|unmount)"
[   25.345678] EXT4-fs (sda1): mounted filesystem with ordered data mode
[   30.456789] EXT4-fs (sda2): mounted filesystem with ordered data mode
Time-Based Filtering
# Show messages from the last 5 minutes
$ dmesg --since "5 minutes ago"

# Show messages from specific time
$ dmesg --since "2025-08-25 06:00:00" --until "2025-08-25 06:30:00"

# Show recent messages (last 1 hour)
$ dmesg -T | grep "$(date '+%b %d %H')"
Common dmesg Use Cases
1. Troubleshooting Hardware Issues
# Check for hardware errors
$ dmesg | grep -i "error\|fail\|warn"
[    5.123456] ACPI Warning: SystemIO range conflicts with OpRegion
[   10.234567] ata1.00: exception Emask 0x0 SAct 0x0 SErr 0x0 action 0x0
[   15.345678] usb 1-1: device descriptor read/64, error -110

# Check for memory issues
$ dmesg | grep -i "memory\|oom\|killed"
[    0.000000] Memory: 16384000K/16777216K available
[12345.678901] Out of memory: Kill process 1234 (chrome) score 856 or sacrifice child
2. Monitoring Network Interfaces
# Check network card status
$ dmesg | grep -i "link\|carrier"
[   25.123456] e1000e: enp0s25 NIC Link is Up 1000 Mbps Full Duplex, Flow Control: Rx/Tx
[   30.234567] e1000e: enp0s25 NIC Link is Down
[   35.345678] e1000e: enp0s25 NIC Link is Up 100 Mbps Full Duplex, Flow Control: None
3. Analyzing System Performance Issues
# Check for CPU throttling
$ dmesg | grep -i "throttle\|thermal"
[12345.678901] CPU0: Core temperature above threshold, cpu clock throttled
[12346.789012] CPU0: Core temperature/speed normal

# Check for I/O issues
$ dmesg | grep -i "blocked\|hung"
[12347.890123] INFO: task kworker/0:1H:123 blocked for more than 120 seconds.
dmesg Configuration and Customization
Color Output
Enable colored output for better readability:
# Enable colors
$ dmesg --color=always

# Disable colors
$ dmesg --color=never

# Auto-detect color support
$ dmesg --color=auto
Output Formatting
# Show facility and priority
$ dmesg -x
<6>[    0.000000] Linux version 5.15.0-56-generic
<6>[    0.000000] Command line: BOOT_IMAGE=/boot/vmlinuz

# Decode facility and priority
$ dmesg --decode
kern  :info : [    0.000000] Linux version 5.15.0-56-generic
kern  :info : [    0.000000] Command line: BOOT_IMAGE=/boot/vmlinuz
Security Considerations
The dmesg command can reveal sensitive system information:
- Hardware details: CPU models, memory sizes, device serial numbers
- Kernel addresses: Potentially useful for exploitation
- System configuration: Boot parameters and loaded modules
To restrict access to dmesg for non-root users:
# Check current setting
$ cat /proc/sys/kernel/dmesg_restrict
0

# Restrict dmesg to root only
$ echo 1 | sudo tee /proc/sys/kernel/dmesg_restrict

# Make permanent by adding to /etc/sysctl.conf
kernel.dmesg_restrict = 1
Alternative Methods to Access Kernel Messages
Using journalctl
On systemd-based systems, kernel messages are also available through journalctl:
# Show kernel messages
$ journalctl -k

# Follow kernel messages
$ journalctl -kf

# Show kernel messages since boot
$ journalctl -k -b
Reading from /dev/kmsg
# Direct access to kernel messages (requires root)
$ sudo cat /dev/kmsg
Best Practices for Using dmesg
- Regular monitoring: Check dmesg output regularly for system health
- Save important output: Redirect output to files for analysis
- Use filtering: Focus on relevant messages using grep and dmesg options
- Understand timestamps: Use -T option for human-readable times
- Monitor in real-time: Use -w option during troubleshooting
- Combine with other tools: Use with top, htop, and system monitoring tools
Creating Useful Aliases
# Add to ~/.bashrc or ~/.bash_aliases
alias dmesg-error='dmesg -T -l err'
alias dmesg-warn='dmesg -T -l warn'
alias dmesg-usb='dmesg | grep -i usb'
alias dmesg-net='dmesg | grep -i "eth\|wlan\|link"'
Troubleshooting Common Issues
dmesg Command Not Found
If dmesg is not available, install it:
# Ubuntu/Debian
$ sudo apt-get install util-linux

# RHEL/CentOS/Fedora
$ sudo yum install util-linux
# or
$ sudo dnf install util-linux
Permission Denied Errors
If you get permission denied when running dmesg:
# Check dmesg_restrict setting
$ cat /proc/sys/kernel/dmesg_restrict

# If set to 1, either use sudo or ask administrator to change setting
$ sudo dmesg
Empty dmesg Output
If dmesg shows no output:
- The kernel ring buffer might be cleared
- Check /var/log/kern.log for persistent kernel messages
- Use journalctl -k as an alternative
Conclusion
The dmesg command is an indispensable tool for Linux system administration, providing direct access to kernel messages that are crucial for troubleshooting, monitoring, and understanding system behavior. By mastering its various options and learning to filter and interpret its output effectively, you can quickly diagnose hardware issues, monitor system performance, and maintain system stability.
Regular use of dmesg, combined with other system monitoring tools, will significantly enhance your ability to maintain and troubleshoot Linux systems effectively. Remember to consider security implications when using dmesg in multi-user environments and always analyze the output in context with other system information for comprehensive troubleshooting.
Related Posts
Core Dump Linux: Complete Guide to Debug Program Crashes and Memory Issues
A core dump is a crucial debugging tool in Linux that captures the complete memory state of a program at...
strace Advanced Linux: Complete Guide to System Call Tracing and Debugging
strace is one of the most powerful debugging and diagnostic tools available in Linux systems. It allows you to trace...
strace Command Linux: Complete Guide to System Call Tracing and Debugging
The strace command is one of the most powerful debugging and monitoring tools available in Linux systems. It allows you...
ltrace Command Linux: Complete Guide to Trace Library Calls and Debug Programs
The ltrace command is a powerful debugging and analysis tool in Linux that allows you to trace library calls made...
debugfs Command Linux: Complete Guide to Debug Ext2/3/4 Filesystems
The debugfs command is a powerful interactive filesystem debugger for ext2, ext3, and ext4 filesystems in Linux. It provides low-level...
logger Command Linux: Complete Guide to System Log Message Management
The logger command in Linux is a powerful utility that allows users and scripts to send messages directly to the...
valgrind Command Linux: Complete Memory Debugging and Profiling Guide
Valgrind is one of the most powerful and essential tools for Linux developers and system administrators who need to debug...

Message Passing: Complete Guide to Inter-Process Communication in Operating Systems
Message passing is a fundamental inter-process communication (IPC) mechanism that enables processes to exchange data and synchronize their activities in...
ptrace Command Linux: Complete Guide to Process Tracing System Call
The ptrace system call is one of Linux's most powerful tools for process monitoring and debugging. It allows one process...
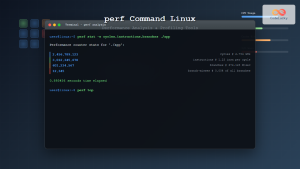
perf Command Linux: Complete Performance Analysis and Profiling Guide
The perf command is one of the most powerful performance analysis tools available in Linux, offering comprehensive insights into system...
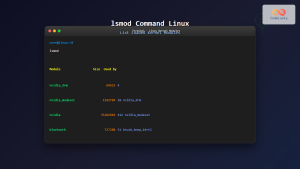
lsmod Command Linux: Complete Guide to Listing Kernel Modules
The lsmod command is an essential Linux utility that displays information about currently loaded kernel modules in your system. Understanding...
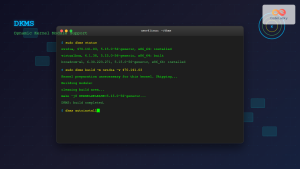
dkms Command Linux: Complete Guide to Dynamic Kernel Module Support
Dynamic Kernel Module Support (DKMS) is a powerful framework that automatically rebuilds kernel modules when you install a new kernel...


