
A core dump is a crucial debugging tool in Linux that captures the complete memory state of a program at the moment it crashes. Understanding how to generate, configure, and analyze core dumps is essential for system administrators and developers who need to troubleshoot application failures and memory-related issues.
What is a Core Dump?
A core dump is a file that contains the memory image of a running process when it terminates abnormally. It includes the program’s memory contents, register values, and other process information at the time of the crash. This snapshot allows developers to analyze what went wrong without reproducing the exact crash conditions.
When Core Dumps are Generated
Core dumps are typically generated when a program receives certain signals:
- SIGSEGV – Segmentation fault (invalid memory access)
- SIGBUS – Bus error (memory alignment issues)
- SIGFPE – Floating-point exception
- SIGQUIT – Quit signal (Ctrl+\)
- SIGABRT – Abort signal from abort() function
- SIGILL – Illegal instruction
Checking Core Dump Configuration
Before working with core dumps, you need to verify and configure your system settings.
Check Current Core Dump Limits
$ ulimit -c
0
A value of 0 means core dumps are disabled. To check all limits:
$ ulimit -a
core file size          (blocks, -c) 0
data seg size           (kbytes, -d) unlimited
scheduling priority             (-e) 0
file size               (blocks, -f) unlimited
pending signals                 (-i) 15679
max locked memory       (kbytes, -l) 65536
max memory size         (kbytes, -m) unlimited
open files                      (-n) 1024
Enable Core Dumps
To enable unlimited core dump size for the current session:
$ ulimit -c unlimitedTo make this permanent, add the following to /etc/security/limits.conf:
*    soft    core    unlimited
*    hard    core    unlimited
Configuring Core Dump Location and Pattern
By default, core dumps are created in the current working directory. You can customize this behavior using kernel parameters.
Check Current Core Pattern
$ cat /proc/sys/kernel/core_pattern
core
Set Custom Core Dump Location
Create a dedicated directory for core dumps:
$ sudo mkdir -p /var/crash
$ sudo chmod 777 /var/crash
Set the core pattern to include useful information:
$ sudo sysctl -w kernel.core_pattern="/var/crash/core.%e.%p.%t"To make this permanent, add to /etc/sysctl.conf:
kernel.core_pattern=/var/crash/core.%e.%p.%tCore Pattern Format Specifiers
| Specifier | Description |
|---|---|
| %p | Process ID (PID) |
| %u | User ID |
| %g | Group ID |
| %s | Signal number |
| %t | Timestamp (seconds since epoch) |
| %e | Executable name |
| %E | Executable path (/ replaced with !) |
Creating Test Programs for Core Dumps
Let’s create some sample programs to demonstrate core dump generation and analysis.
Segmentation Fault Example
Create segfault.c:
#include <stdio.h>
#include <stdlib.h>

int main() {
    int *ptr = NULL;
    printf("About to dereference NULL pointer...\n");
    *ptr = 42;  // This will cause a segmentation fault
    return 0;
}
Compile with debugging symbols:
$ gcc -g -o segfault segfault.cArray Overflow Example
Create overflow.c:
#include <stdio.h>
#include <string.h>

int main() {
    char buffer[10];
    printf("Causing buffer overflow...\n");
    strcpy(buffer, "This string is way too long for the buffer");
    printf("Buffer: %s\n", buffer);
    return 0;
}
Compile:
$ gcc -g -fno-stack-protector -o overflow overflow.cGenerating Core Dumps
Now let’s generate core dumps using our test programs.
Run the Segfault Program
$ ./segfault
About to dereference NULL pointer...
Segmentation fault (core dumped)
Check for the generated core file:
$ ls -la /var/crash/
total 200
drwxrwxrwx  2 root root   4096 Aug 25 09:15 .
drwxr-xr-x 14 root root   4096 Aug 25 09:10 ..
-rw-------  1 user user 200704 Aug 25 09:15 core.segfault.12345.1629876543
Manual Core Dump Generation
You can generate a core dump of a running process using:
$ kill -QUIT <PID>Or using gcore:
$ gcore <PID>Analyzing Core Dumps with GDB
The GNU Debugger (GDB) is the primary tool for analyzing core dumps in Linux.
Loading Core Dump in GDB
$ gdb ./segfault /var/crash/core.segfault.12345.1629876543GDB will display information about the crash:
GNU gdb (Ubuntu 9.2-0ubuntu1~20.04) 9.2
Copyright (C) 2020 Free Software Foundation, Inc.
...
Core was generated by `./segfault'.
Program terminated with signal SIGSEGV, Segmentation fault.
#0  0x0000555555555149 in main () at segfault.c:6
6           *ptr = 42;  // This will cause a segmentation fault
(gdb)
Essential GDB Commands for Core Analysis
View Backtrace
(gdb) bt
#0  0x0000555555555149 in main () at segfault.c:6
Examine Variables
(gdb) print ptr
$1 = (int *) 0x0

(gdb) info locals
ptr = 0x0
View Source Code
(gdb) list
1       #include <stdio.h>
2       #include <stdlib.h>
3
4       int main() {
5           int *ptr = NULL;
6           printf("About to dereference NULL pointer...\n");
7           *ptr = 42;  // This will cause a segmentation fault
8           return 0;
9       }
Examine Memory
(gdb) x/10x $sp
0x7fffffffddf0: 0x00000000      0x00000000      0xf7df2b25      0x00007fff
0x7fffffffde00: 0x00000000      0x00000001      0x555551a0      0x00005555
0x7fffffffde10: 0xffffdf08      0x00007fff
View Registers
(gdb) info registers
rax            0x0                 0
rbx            0x0                 0
rcx            0x7ffff7dcf718      140737351734040
rdx            0x7ffff7dd0760      140737351738208
Advanced Core Dump Analysis Techniques
Analyzing Multi-threaded Programs
For multi-threaded applications, you can examine different threads:
(gdb) info threads
  Id   Target Id         Frame
* 1    Thread 0x7ffff7feb740 (LWP 12345) main () at program.c:25
  2    Thread 0x7ffff77ea700 (LWP 12346) worker_thread () at program.c:15

(gdb) thread 2
[Switching to thread 2 (Thread 0x7ffff77ea700 (LWP 12346))]

(gdb) bt
#0  worker_thread () at program.c:15
#1  0x00007ffff7bc6609 in start_thread () from /lib/x86_64-linux-gnu/libpthread.so.0
Examining Heap Corruption
Create a heap corruption example (heap_bug.c):
#include <stdio.h>
#include <stdlib.h>
#include <string.h>

int main() {
    char *buffer = malloc(10);
    printf("Allocated buffer at: %p\n", buffer);

    // Overflow the allocated buffer
    strcpy(buffer, "This string is definitely too long for a 10-byte buffer");

    printf("Buffer content: %s\n", buffer);
    free(buffer);
    return 0;
}
Compile and run:
$ gcc -g -o heap_bug heap_bug.c
$ ./heap_bug
Using Valgrind for Advanced Analysis
Valgrind can provide additional insights when combined with core dumps:
$ valgrind --tool=memcheck --leak-check=full --generate-suppressions=all ./programAutomating Core Dump Analysis
Core Dump Analysis Script
Create a bash script to automate basic analysis:
#!/bin/bash
# analyze_core.sh

if [ "$#" -ne 2 ]; then
    echo "Usage: $0 <executable> <core_file>"
    exit 1
fi

EXECUTABLE=$1
CORE_FILE=$2

echo "=== Core Dump Analysis ==="
echo "Executable: $EXECUTABLE"
echo "Core file: $CORE_FILE"
echo "Generated: $(stat -c %y "$CORE_FILE")"
echo "Size: $(stat -c %s "$CORE_FILE") bytes"
echo

echo "=== GDB Analysis ==="
gdb --batch --quiet \
    -ex "bt" \
    -ex "info registers" \
    -ex "info locals" \
    -ex "quit" \
    "$EXECUTABLE" "$CORE_FILE"
Make it executable and use:
$ chmod +x analyze_core.sh
$ ./analyze_core.sh ./segfault /var/crash/core.segfault.12345.1629876543
System-wide Core Dump Management
Using systemd-coredump
Modern Linux distributions often use systemd-coredump for managing core dumps:
$ sudo systemctl status systemd-coredumpView collected core dumps:
$ coredumpctl list
TIME                            PID   UID   GID SIG COREFILE  EXE
Mon 2025-08-25 09:15:23 IST   12345  1000  1000  11 present   /home/user/segfault
Analyze with coredumpctl:
$ coredumpctl gdb 12345Core Dump Rotation and Cleanup
Create a cleanup script to manage old core dumps:
#!/bin/bash
# cleanup_cores.sh

CORE_DIR="/var/crash"
MAX_AGE=7  # days

find "$CORE_DIR" -name "core.*" -type f -mtime +$MAX_AGE -exec rm -f {} \;
echo "Cleaned up core dumps older than $MAX_AGE days"
Best Practices for Core Dump Management
Security Considerations
- Restrict access – Core dumps may contain sensitive information
- Set proper permissions – Use mode 0600 for core files
- Secure storage – Store core dumps in protected directories
- Regular cleanup – Remove old core dumps to save disk space
Production Environment Setup
# /etc/security/limits.conf
*    soft    core    unlimited
*    hard    core    unlimited

# /etc/sysctl.conf
kernel.core_pattern=/var/crash/core.%e.%p.%t
fs.suid_dumpable=2
Monitoring Core Dumps
Set up monitoring to alert when core dumps are generated:
#!/bin/bash
# monitor_cores.sh

CORE_DIR="/var/crash"
LOGFILE="/var/log/core_dumps.log"

inotifywait -m "$CORE_DIR" -e create --format '%T %w%f' --timefmt '%Y-%m-%d %H:%M:%S' | \
while read event; do
    echo "$event - Core dump detected" | tee -a "$LOGFILE"
    # Add alerting mechanism here (email, Slack, etc.)
done
Troubleshooting Common Issues
Core Dumps Not Generated
If core dumps aren’t being created, check:
- ulimit settings – Ensure core size limit is not 0
- Directory permissions – Verify write access to core dump location
- Disk space – Check available space in the target directory
- SELinux/AppArmor – Security policies may prevent core dump generation
# Check current limits
$ ulimit -a

# Verify directory permissions
$ ls -ld /var/crash

# Check disk space
$ df -h /var/crash

# Check SELinux status
$ sestatus
Large Core Dump Files
Core dumps can be very large. Use compression to save space:
$ gzip /var/crash/core.program.12345.1629876543GDB can work with compressed core dumps:
$ gdb ./program /var/crash/core.program.12345.1629876543.gzIntegration with Development Workflow
Continuous Integration Setup
In CI/CD pipelines, configure core dump collection for test failures:
# In your CI script
ulimit -c unlimited
export CORE_PATTERN="/tmp/cores/core.%e.%p.%t"

# Run tests
./run_tests.sh

# Collect and analyze any core dumps
if ls /tmp/cores/core.* 1> /dev/null 2>&1; then
    echo "Core dumps detected - analyzing..."
    for core in /tmp/cores/core.*; do
        analyze_core.sh ./test_binary "$core"
    done
fi
Conclusion
Core dumps are invaluable tools for debugging program crashes and understanding application behavior at the point of failure. By properly configuring core dump generation, learning to analyze them with GDB, and implementing good management practices, you can significantly improve your debugging capabilities and system reliability.
Remember to balance the benefits of core dump analysis with security and storage considerations, especially in production environments. Regular monitoring and cleanup procedures will help maintain an effective debugging workflow while keeping your system secure and efficient.
Master these techniques, and you’ll be well-equipped to tackle even the most challenging debugging scenarios in your Linux environment.
Related Posts
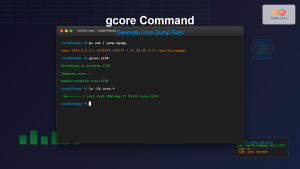
gcore Command Linux: Complete Guide to Generate Core Dump Files for Debugging
The gcore command in Linux is a powerful debugging tool that generates core dump files from running processes without terminating...
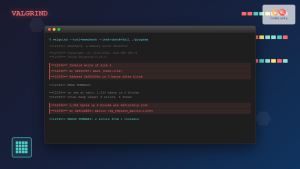
valgrind Command Linux: Complete Memory Debugging and Profiling Guide
Valgrind is one of the most powerful and essential tools for Linux developers and system administrators who need to debug...
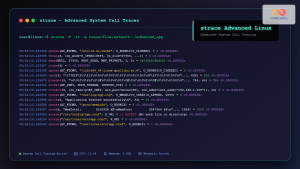
strace Advanced Linux: Complete Guide to System Call Tracing and Debugging
strace is one of the most powerful debugging and diagnostic tools available in Linux systems. It allows you to trace...

Garbage Collection in Operating System: Complete Guide to Automatic Memory Management
What is Garbage Collection in Operating Systems? Garbage collection is an automatic memory management technique used by operating systems and...
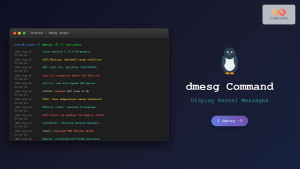
dmesg Command Linux: Complete Guide to Display and Analyze Kernel Messages
The dmesg command is one of the most powerful diagnostic tools in Linux, providing administrators and users with direct access...
ptrace Command Linux: Complete Guide to Process Tracing System Call
The ptrace system call is one of Linux's most powerful tools for process monitoring and debugging. It allows one process...
Process in Operating System: Complete Guide to Definition, States and Lifecycle
What is a Process in Operating System? A process is a program in execution that consists of the program code...

Memory Fragmentation: Internal vs External Fragmentation in Operating Systems
Memory fragmentation is one of the most critical challenges in operating system memory management, directly impacting system performance and resource...
perf Command Linux: Complete Performance Analysis and Profiling Guide
The perf command is one of the most powerful performance analysis tools available in Linux, offering comprehensive insights into system...
Memory Protection: Hardware and Software Mechanisms for Secure Computing
Understanding Memory Protection in Modern Computing Memory protection is a fundamental security mechanism that prevents programs from accessing memory regions...
debugfs Command Linux: Complete Guide to Debug Ext2/3/4 Filesystems
The debugfs command is a powerful interactive filesystem debugger for ext2, ext3, and ext4 filesystems in Linux. It provides low-level...
strace Command Linux: Complete Guide to System Call Tracing and Debugging
The strace command is one of the most powerful debugging and monitoring tools available in Linux systems. It allows you...
- What is a Core Dump?
- Checking Core Dump Configuration
- Configuring Core Dump Location and Pattern
- Creating Test Programs for Core Dumps
- Generating Core Dumps
- Analyzing Core Dumps with GDB
- Advanced Core Dump Analysis Techniques
- Automating Core Dump Analysis
- System-wide Core Dump Management
- Best Practices for Core Dump Management
- Troubleshooting Common Issues
- Integration with Development Workflow
- Conclusion


