
The collectd daemon is a powerful system statistics collection tool for Linux that gathers performance metrics from various system components and applications. As a lightweight, modular solution, collectd excels at collecting, transferring, and storing performance data efficiently without consuming significant system resources.
What is collectd?
Collectd is a Unix daemon that collects system and application performance metrics periodically and provides mechanisms to store the values in various formats. Written in C for performance and portability, collectd supports over 100 plugins that can monitor everything from basic system metrics to complex application statistics.
Key Features of collectd
- Lightweight Design: Minimal resource consumption
- Modular Architecture: Plugin-based system for extensibility
- Multi-platform Support: Works on various Unix-like systems
- Flexible Storage: Multiple output formats and destinations
- Network Capabilities: Can send data to remote servers
- Real-time Monitoring: Continuous data collection
Installing collectd on Linux
Installation methods vary depending on your Linux distribution. Here are the most common approaches:
Ubuntu/Debian Installation
# Update package repository
sudo apt update

# Install collectd and common plugins
sudo apt install collectd collectd-utils

# Install additional plugins (optional)
sudo apt install collectd-core collectd-dev
CentOS/RHEL/Fedora Installation
# For CentOS/RHEL with EPEL repository
sudo yum install epel-release
sudo yum install collectd

# For Fedora
sudo dnf install collectd

# For newer CentOS/RHEL versions
sudo dnf install collectd
Arch Linux Installation
# Install from official repositories
sudo pacman -S collectd
Basic Configuration
The main configuration file is typically located at /etc/collectd/collectd.conf or /etc/collectd.conf. Let’s examine the basic configuration structure:
Main Configuration File Structure
# Global settings
Hostname "webserver01"
FQDNLookup true
BaseDir "/var/lib/collectd"
PluginDir "/usr/lib/collectd"
TypesDB "/usr/share/collectd/types.db"

# Logging configuration
LoadPlugin syslog
<Plugin syslog>
    LogLevel info
</Plugin>

# Interval for collecting data (in seconds)
Interval 10

# Load essential plugins
LoadPlugin cpu
LoadPlugin memory
LoadPlugin disk
LoadPlugin network
LoadPlugin interface
Enabling and Starting collectd
# Enable collectd service to start at boot
sudo systemctl enable collectd

# Start the collectd service
sudo systemctl start collectd

# Check service status
sudo systemctl status collectd

# View real-time logs
sudo journalctl -u collectd -f
Expected Output:
● collectd.service - Collectd statistics daemon
   Loaded: loaded (/lib/systemd/system/collectd.service; enabled; vendor preset: enabled)
   Active: active (running) since Tue 2025-08-26 05:53:12 IST; 2min 15s ago
     Docs: man:collectd(1)
           man:collectd.conf(5)
 Main PID: 12345 (collectd)
   CGroup: /system.slice/collectd.service
           └─12345 /usr/sbin/collectd -C /etc/collectd/collectd.conf -f

Aug 26 05:53:12 webserver01 systemd[1]: Started Collectd statistics daemon.
Essential Plugins Configuration
Collectd’s power lies in its plugin architecture. Let’s configure some essential plugins for comprehensive system monitoring:
CPU Plugin Configuration
LoadPlugin cpu
<Plugin cpu>
    ReportByCpu true
    ReportByState true
    ValuesPercentage true
</Plugin>
Memory Plugin Configuration
LoadPlugin memory
<Plugin memory>
    ValuesAbsolute true
    ValuesPercentage true
</Plugin>
Disk Plugin Configuration
LoadPlugin disk
<Plugin disk>
    Disk "/dev/sda"
    Disk "/dev/sdb"
    IgnoreSelected false
    UseBSDName false
    UdevNameAttr "DEVNAME"
</Plugin>
Network Interface Plugin
LoadPlugin interface
<Plugin interface>
    Interface "eth0"
    Interface "wlan0"
    IgnoreSelected false
    ReportInactive true
</Plugin>
Advanced Plugin Configurations
MySQL Database Monitoring
LoadPlugin mysql
<Plugin mysql>
    <Database "production">
        Host "localhost"
        User "collectd"
        Password "secure_password"
        Database "myapp"
        MasterStats true
        ConnectTimeout 10
    </Database>
</Plugin>
Apache Web Server Monitoring
LoadPlugin apache
<Plugin apache>
    <Instance "local">
        URL "http://localhost/server-status?auto"
        Server "apache"
        CACert "/etc/ssl/certs/ca-certificates.crt"
    </Instance>
</Plugin>
Process Monitoring
LoadPlugin processes
<Plugin processes>
    Process "apache2"
    Process "mysql"
    Process "nginx"
    ProcessMatch "php" "php.*"
    CollectContextSwitch true
    CollectFileDescriptor true
</Plugin>
Data Storage and Output Options
Collectd supports multiple storage backends. Here are the most commonly used options:
RRD (Round Robin Database) Storage
LoadPlugin rrdtool
<Plugin rrdtool>
    DataDir "/var/lib/collectd/rrd"
    CacheTimeout 120
    CacheFlush 900
    WritesPerSecond 30
</Plugin>
CSV File Output
LoadPlugin csv
<Plugin csv>
    DataDir "/var/lib/collectd/csv"
    StoreRates false
</Plugin>
Network Output (Client Mode)
LoadPlugin network
<Plugin network>
    Server "monitoring.example.com" "25826"
    TimeToLive 128
    Forward false
    ReportStats true
</Plugin>
Network Input (Server Mode)
LoadPlugin network
<Plugin network>
    Listen "*" "25826"
    SecurityLevel Encrypt
    AuthFile "/etc/collectd/auth_file"
    Interface "eth0"
</Plugin>
Monitoring System Performance with collectd
Viewing Collected Data
Once collectd is running and collecting data, you can examine the stored information:
# List RRD files (if using RRD storage)
ls -la /var/lib/collectd/rrd/hostname/

# Example directory structure:
# cpu-0/
# cpu-1/
# memory/
# interface-eth0/
# disk-sda/
Using collectd-tg for Testing
The collectd-tg utility helps test network functionality:
# Install collectd utilities
sudo apt install collectd-utils

# Test network connectivity
collectd-tg -n 100 -i 1 -H monitoring.server.com -p 25826

# Generate test data
collectd-tg -n 1000 -i 0.1 -d test-host -v cpu/percent-idle=50
Integration with Grafana
To visualize collectd data effectively, integrate it with Grafana using InfluxDB:
InfluxDB Output Configuration
LoadPlugin write_http
<Plugin write_http>
    <Node "influxdb">
        URL "http://localhost:8086/write?db=collectd"
        Format "JSON"
        StoreRates true
        BufferSize 5000
        Timeout 10000
    </Node>
</Plugin>
Troubleshooting Common Issues
Permission Problems
# Fix collectd data directory permissions
sudo chown -R collectd:collectd /var/lib/collectd/
sudo chmod 755 /var/lib/collectd/

# Check collectd user exists
getent passwd collectd
Plugin Loading Issues
# Test configuration syntax
sudo collectd -T -C /etc/collectd/collectd.conf

# Run collectd in foreground for debugging
sudo collectd -f -C /etc/collectd/collectd.conf
Network Connectivity Issues
# Check if collectd is listening on network port
sudo netstat -tulpn | grep :25826

# Test UDP connectivity
nc -u monitoring.server.com 25826

# Check firewall rules
sudo iptables -L | grep 25826
Performance Tuning
Optimizing Collection Intervals
# Global interval setting
Interval 30

# Plugin-specific intervals
<Plugin cpu>
    Interval 10
</Plugin>

<Plugin memory>
    Interval 60
</Plugin>
Memory Usage Optimization
# Reduce cache size for memory-constrained systems
<Plugin rrdtool>
    CacheTimeout 60
    CacheFlush 300
    WritesPerSecond 10
</Plugin>
Security Considerations
Network Security Configuration
# Enable encryption for network communication
<Plugin network>
    SecurityLevel Encrypt
    AuthFile "/etc/collectd/auth_file"

    # Create auth file
    # echo "user: password" > /etc/collectd/auth_file
    # chmod 600 /etc/collectd/auth_file
    # chown collectd:collectd /etc/collectd/auth_file
</Plugin>
File System Permissions
# Secure configuration file
sudo chmod 640 /etc/collectd/collectd.conf
sudo chown root:collectd /etc/collectd/collectd.conf

# Secure data directories
sudo chmod 750 /var/lib/collectd/
sudo chown collectd:collectd /var/lib/collectd/
Monitoring collectd Performance
Internal Statistics
Monitor collectd’s own performance:
LoadPlugin logfile
<Plugin logfile>
    LogLevel info
    File "/var/log/collectd.log"
    Timestamp true
</Plugin>

# Enable internal statistics
LoadPlugin unixsock
<Plugin unixsock>
    SocketFile "/var/run/collectd-unixsock"
    SocketGroup "collectd"
    SocketPerms "0660"
</Plugin>
Querying Internal Statistics
# Connect to unix socket
echo "LISTVAL" | socat - UNIX-CONNECT:/var/run/collectd-unixsock

# Get specific values
echo "GETVAL hostname/cpu-0/cpu-idle" | socat - UNIX-CONNECT:/var/run/collectd-unixsock
Best Practices
- Start Simple: Begin with basic plugins and gradually add more complex monitoring
- Regular Backups: Backup configuration files and historical data regularly
- Monitor Resource Usage: Keep track of collectd’s own resource consumption
- Use Appropriate Intervals: Balance data granularity with system load
- Implement Security: Use encryption for network communications
- Plan Storage: Consider long-term storage requirements for historical data
- Test Configurations: Always test configuration changes in development environments
Conclusion
Collectd is an excellent choice for system monitoring in Linux environments, offering flexibility, performance, and comprehensive coverage of system metrics. Its modular design allows administrators to customize monitoring solutions according to specific requirements while maintaining minimal system overhead.
By following the configurations and best practices outlined in this guide, you can implement a robust monitoring solution that provides valuable insights into your system’s performance and helps maintain optimal operation of your Linux infrastructure.
Remember to regularly review and update your collectd configuration as your monitoring needs evolve, and always test changes thoroughly before implementing them in production environments.
Related Posts
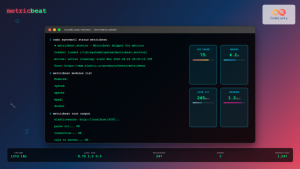
metricbeat Linux: Complete Guide to System and Service Metrics Monitoring
Metricbeat is a lightweight shipper that helps you monitor your systems and services by collecting metrics from the operating system...
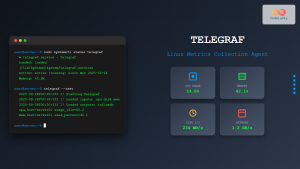
Telegraf Linux: Complete Guide to Installing and Configuring the Metrics Collection Agent
Telegraf is a powerful, plugin-driven server agent for collecting and reporting metrics from databases, systems, and IoT sensors. As part...
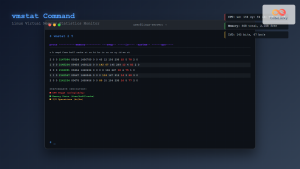
vmstat Command Linux: Monitor Virtual Memory and System Performance Statistics
The vmstat command is one of the most powerful and essential tools for Linux system administrators and developers to monitor...

Garbage Collection in Operating System: Complete Guide to Automatic Memory Management
What is Garbage Collection in Operating Systems? Garbage collection is an automatic memory management technique used by operating systems and...

top Command Linux: Complete Guide to Real-Time Process Monitoring
The top command is one of the most essential tools in a Linux system administrator's arsenal. It provides real-time information...

InfluxDB Linux: Complete Guide to Time Series Database Installation and Management
InfluxDB is a powerful open-source time series database designed to handle high write and query loads for applications involving time-stamped...
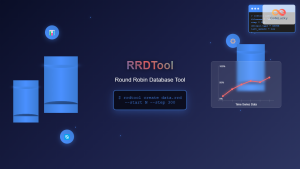
rrdtool Command Linux: Complete Guide to Round Robin Database Tool
The rrdtool (Round Robin Database Tool) is a powerful Linux command-line utility designed for storing and displaying time-series data in...
htop Command Linux: Complete Guide to Advanced Process Monitoring and Management
The htop command is an enhanced, interactive version of the traditional top command that provides real-time monitoring of system processes...
perf Command Linux: Complete Performance Analysis and Profiling Guide
The perf command is one of the most powerful performance analysis tools available in Linux, offering comprehensive insights into system...
ps Command in Linux: Complete Guide to Process Monitoring and Management
The ps command is one of the most fundamental and powerful tools in Linux for displaying information about running processes....
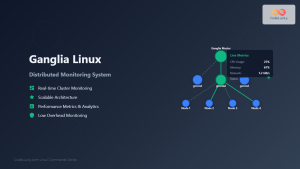
ganglia Linux: Complete Guide to Distributed Monitoring System
Ganglia is a powerful, open-source distributed monitoring system designed specifically for high-performance computing clusters, grids, and cloud infrastructures. Originally developed...
Groundwork Linux: Complete Guide to IT Infrastructure Monitoring and System Health Management
What is Groundwork Linux? Groundwork Linux is a comprehensive open-source IT infrastructure monitoring platform built specifically for Linux environments. It...


