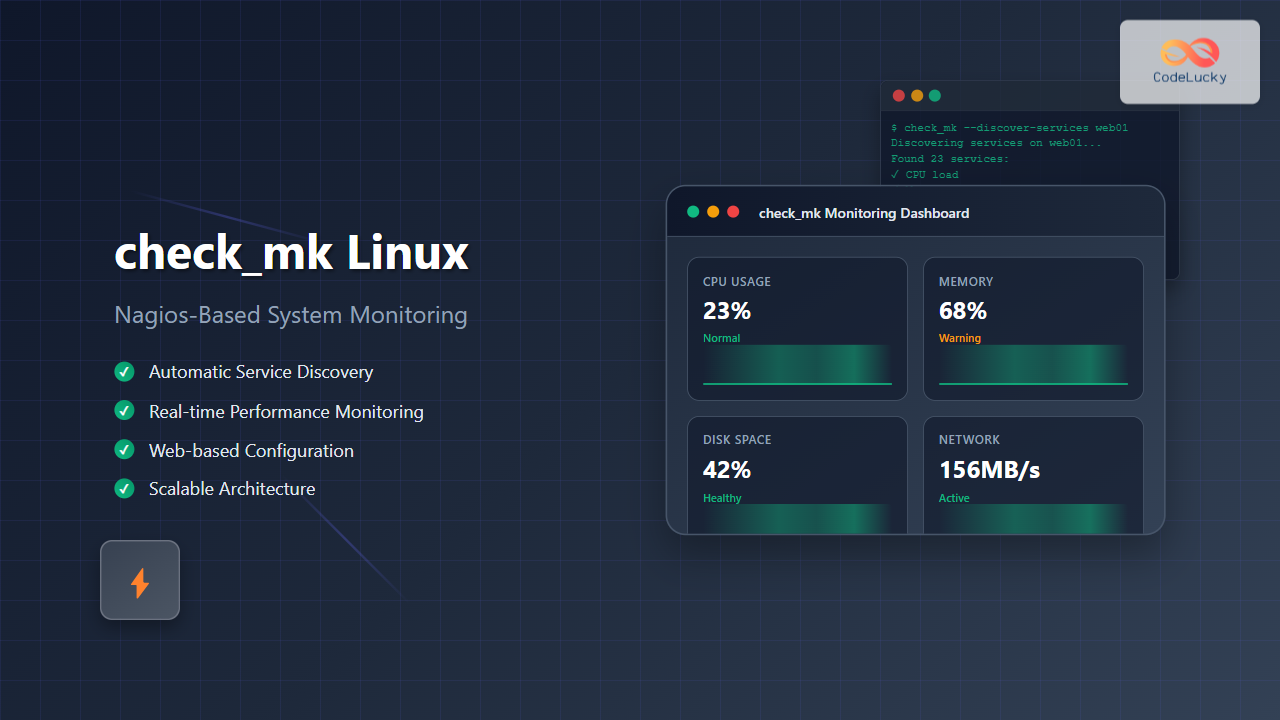
check_mk is a powerful monitoring system built on top of Nagios that simplifies infrastructure monitoring with automated service discovery and efficient data collection. This comprehensive guide will walk you through everything you need to know about implementing check_mk on Linux systems.
What is check_mk?
check_mk is an extension to Nagios that provides enhanced monitoring capabilities with a focus on automation and scalability. Unlike traditional Nagios setups that require manual configuration of each service, check_mk automatically discovers services and creates monitoring rules dynamically.
Key Features of check_mk
- Automatic Service Discovery: Automatically detects services running on monitored hosts
- Agent-based Monitoring: Uses lightweight agents for comprehensive system monitoring
- Web-based Configuration: Intuitive web interface for management
- High Performance: Efficient data collection and processing
- Extensible Architecture: Support for custom plugins and checks
check_mk Architecture
Understanding the architecture is crucial for effective implementation:
Core Components
- check_mk Server: Central monitoring server running Nagios core
- check_mk Agent: Lightweight agent installed on monitored hosts
- WATO (Web Administration Tool): Web-based configuration interface
- Livestatus: High-performance interface for status data
- Multisite: Web-based GUI for viewing monitoring data
Installation Guide
Prerequisites
Before installing check_mk, ensure your system meets these requirements:
# Check system requirements
cat /etc/os-release
free -h
df -h /opt
Expected Output:
NAME="Ubuntu"
VERSION="20.04.3 LTS"
              total        used        free
Mem:           7.7G        2.1G        3.2G
Filesystem      Size  Used Avail Use% Mounted on
/dev/sda1       50G   15G   33G  32% /opt
Installing check_mk on Ubuntu/Debian
Follow these steps to install check_mk Raw Edition:
# Update system packages
sudo apt update && sudo apt upgrade -y

# Install required dependencies
sudo apt install -y wget curl apache2 php php-gd php-mbstring

# Download check_mk Raw Edition
wget https://download.checkmk.com/checkmk/2.2.0p10/check-mk-raw-2.2.0p10_0.focal_amd64.deb

# Install check_mk
sudo dpkg -i check-mk-raw-2.2.0p10_0.focal_amd64.deb

# Fix any dependency issues
sudo apt-get install -f
Installing on CentOS/RHEL
# Install EPEL repository
sudo yum install -y epel-release

# Install dependencies
sudo yum install -y wget httpd php php-gd php-mbstring

# Download and install check_mk
wget https://download.checkmk.com/checkmk/2.2.0p10/check-mk-raw-2.2.0p10-el8-x86_64.rpm
sudo rpm -i check-mk-raw-2.2.0p10-el8-x86_64.rpm
Initial Configuration
Creating a Monitoring Site
After installation, create your first monitoring site:
# Create a new site named "monitoring"
sudo omd create monitoring

# Start the site
sudo omd start monitoring

# Check site status
sudo omd status monitoring
Expected Output:
Created new site monitoring with version 2.2.0p10.cre.
  The site can be started with omd start monitoring.
  The default web UI is available at http://myserver/monitoring/
  The default admin user is cmkadmin with password: randompassword

Overall state: running
apache:          running
core:            running
crontab:         running
mkeventd:        running
mknotifyd:       running
rrdcached:       running
Accessing the Web Interface
Access the web interface at http://your-server-ip/monitoring using:
- Username: cmkadmin
- Password: (generated during site creation)
Configuring Host Monitoring
Adding Hosts via Web Interface
Navigate to WATO → Hosts and follow these steps:
- Click “Create new host”
- Enter hostname and IP address
- Configure monitoring agents
- Save and activate changes
Command Line Host Addition
# Switch to monitoring site user
sudo su - monitoring

# Add a new host
check_mk --create-host --hostname web01 --ipaddress 192.168.1.100

# Discover services on the host
check_mk --discover-services web01

# Generate configuration
check_mk --compile-nagios-config

# Reload configuration
check_mk --reload
Installing and Configuring Agents
Linux Agent Installation
Install the check_mk agent on monitored Linux systems:
# Download the agent
wget http://your-check-mk-server/monitoring/check_mk/agents/check_mk_agent.linux

# Make it executable
chmod +x check_mk_agent.linux

# Copy to appropriate location
sudo cp check_mk_agent.linux /usr/bin/check_mk_agent

# Configure xinetd service
sudo tee /etc/xinetd.d/check_mk <<EOF
service check_mk
{
        type           = UNLISTED
        port           = 6556
        socket_type    = stream
        protocol       = tcp
        wait           = no
        user           = root
        server         = /usr/bin/check_mk_agent
        log_on_failure += USERID
        disable        = no
        only_from      = 192.168.1.50
}
EOF

# Restart xinetd
sudo systemctl restart xinetd
sudo systemctl enable xinetd
Testing Agent Connection
Verify the agent is working properly:
# Test from monitoring server
telnet 192.168.1.100 6556
Expected Output:
<<<check_mk>>>
Version: 2.2.0p10
AgentOS: linux
Hostname: web01
AgentDirectory: /etc/check_mk
DataDirectory: /var/lib/check_mk_agent
SpoolDirectory: /var/lib/check_mk_agent/spool
PluginsDirectory: /usr/lib/check_mk_agent/plugins
LocalDirectory: /usr/lib/check_mk_agent/local

<<<uptime>>>
 14:30:25 up 5 days,  3:45,  2 users,  load average: 0.15, 0.18, 0.12
Service Discovery and Monitoring
Automatic Service Discovery
check_mk excels at automatic service discovery. Here’s how it works:
# Discover services for a specific host
check_mk --discover-services web01

# Discover services for all hosts
check_mk --discover-services @all

# Show discovered services
check_mk --list-services web01
Sample Discovery Output:
Discovering services on web01...
Found 23 services:
  CPU load
  CPU utilization
  Disk IO /
  Disk IO /home
  Filesystem /
  Filesystem /home
  Memory
  Network interface eth0
  Process apache2
  Process sshd
  Uptime
Manual Service Configuration
For custom monitoring requirements, create manual service rules:
# Edit main configuration
sudo su - monitoring
vi etc/check_mk/main.mk

# Add custom check parameters
extra_host_conf["check_command"] = [
    ("check_http!-H $HOSTADDRESS$ -p 80", ["web01"]),
]

# Compile and reload
check_mk --compile-nagios-config
check_mk --reload
Advanced Configuration
Custom Plugins
Create custom monitoring plugins for specific requirements:
# Create a custom plugin
sudo tee /usr/lib/check_mk_agent/plugins/custom_app <<'EOF'
#!/bin/bash
echo "<<<custom_app>>>"
ps aux | grep my_application | wc -l
EOF

sudo chmod +x /usr/lib/check_mk_agent/plugins/custom_app
Notification Configuration
Configure email notifications through WATO:
- Go to WATO → Notifications
- Create notification rules
- Configure SMTP settings
- Test notification delivery
Performance Data and Graphs
Enable performance data collection:
# Configure PNP4Nagios integration
sudo su - monitoring
vi etc/nagios/nagios.cfg

# Add performance data processing
process_performance_data=1
service_perfdata_command=process-service-perfdata
host_perfdata_command=process-host-perfdata
Monitoring Best Practices
Host and Service Groups
Organize monitoring objects efficiently:
# Create host groups in main.mk
define_hostgroups = True

host_groups = [
    ("linux-servers", "Linux Servers", ["web01", "db01", "app01"]),
    ("web-servers", "Web Servers", ["web01", "web02"]),
]
Thresholds and Alerting
Configure appropriate thresholds to avoid alert fatigue:
# Configure filesystem thresholds
filesystem_levels = [
    ("95%", "98%", ["web01"]),
    ("90%", "95%", ["@all"]),
]

# Configure memory thresholds
memory_levels = [
    (80.0, 90.0, ["@all"]),
]
Troubleshooting Common Issues
Agent Connection Problems
Debug agent connectivity issues:
# Check if agent is listening
sudo netstat -tlnp | grep :6556

# Test agent manually
sudo /usr/bin/check_mk_agent

# Check firewall rules
sudo iptables -L | grep 6556

# Check xinetd logs
sudo tail -f /var/log/messages | grep xinetd
Service Discovery Issues
Resolve service discovery problems:
# Verbose discovery output
check_mk --discover-services --verbose web01

# Check agent output
check_mk --get-agent-output web01

# Validate configuration
check_mk --compile-nagios-config --verbose
Performance Optimization
Tuning check_mk Performance
Optimize for large environments:
# Increase check intervals for non-critical services
extra_service_conf["check_interval"] = [
    (10, ["web01"], ["Filesystem"]),
    (5, ["web01"], ["CPU load"]),
]

# Configure parallel processing
extra_host_conf["max_check_attempts"] = [
    (3, ["@all"]),
]
Database Optimization
Optimize the underlying database:
# Configure livestatus tuning
sudo su - monitoring
vi etc/nagios/nagios.cfg

# Add livestatus optimizations
livestatus_socket=/omd/sites/monitoring/tmp/run/live
enable_environment_macros=0
Security Considerations
Securing Agent Communication
Implement security measures for agent communication:
# Configure agent encryption
sudo tee /etc/check_mk/encryption.cfg <<EOF
ENCRYPT=yes
PASSPHRASE=your_secure_passphrase
EOF

# Restrict agent access
sudo tee -a /etc/xinetd.d/check_mk <<EOF
only_from = 192.168.1.50 192.168.1.51
EOF

sudo systemctl restart xinetd
Web Interface Security
Secure the web interface:
- Enable HTTPS
- Configure strong authentication
- Implement user roles and permissions
- Regular security updates
Backup and Disaster Recovery
Site Backup
Create regular backups of your monitoring site:
# Create site backup
sudo omd backup monitoring /opt/backups/monitoring-$(date +%Y%m%d).tar.gz

# Restore from backup
sudo omd restore monitoring /opt/backups/monitoring-20240826.tar.gz

# Schedule automated backups
echo "0 2 * * * omd backup monitoring /opt/backups/monitoring-$(date +\%Y\%m\%d).tar.gz" | sudo crontab -
Integration with Other Tools
Grafana Integration
Integrate check_mk with Grafana for enhanced visualization:
# Install Grafana plugin
sudo su - monitoring
cd local/lib/python3/cmk/gui/plugins/dashboard/

# Configure data source in Grafana
# URL: http://your-server/monitoring/check_mk/api/1.0/
API Usage
Utilize the check_mk REST API for automation:
# Get host information via API
curl -u "cmkadmin:password" \
  "http://your-server/monitoring/check_mk/api/1.0/objects/host_config/web01"

# Add host via API
curl -X POST \
  -H "Content-Type: application/json" \
  -u "cmkadmin:password" \
  -d '{"hostname": "new-server", "folder": "/", "attributes": {"ipaddress": "192.168.1.200"}}' \
  "http://your-server/monitoring/check_mk/api/1.0/objects/host_config"
Conclusion
check_mk provides a robust and scalable monitoring solution that significantly simplifies infrastructure monitoring compared to traditional Nagios setups. Its automatic service discovery, intuitive web interface, and extensive customization options make it an excellent choice for organizations of all sizes.
Key benefits include reduced configuration overhead, comprehensive monitoring capabilities, and excellent performance characteristics. Regular maintenance, proper security implementation, and following best practices ensure optimal operation of your monitoring infrastructure.
Start with a basic setup and gradually expand your monitoring scope as you become more familiar with check_mk’s capabilities. The investment in proper monitoring pays dividends in system reliability and operational efficiency.

