
The cbm (Color Bandwidth Meter) command is a powerful Linux utility that provides real-time monitoring of network bandwidth usage with an intuitive, colorful display. This tool helps system administrators and users track network traffic across different interfaces, making it easier to identify bandwidth bottlenecks and monitor network performance.
What is cbm Command?
CBM stands for Color Bandwidth Meter, a command-line network monitoring tool that displays bandwidth usage statistics in real-time. Unlike traditional text-based monitoring tools, cbm presents data using colors and graphical elements, making it more visually appealing and easier to interpret network traffic patterns.
Key Features of cbm
- Real-time monitoring: Displays live bandwidth usage statistics
- Colorful interface: Uses colors to differentiate between different types of traffic
- Multiple interfaces: Monitors multiple network interfaces simultaneously
- Customizable display: Adjustable refresh rates and display options
- Lightweight: Minimal system resource usage
Installing cbm Command
Before using cbm, you need to install it on your Linux system. The installation method varies depending on your distribution:
Ubuntu/Debian Systems
sudo apt update
sudo apt install cbm
Red Hat/CentOS/Fedora Systems
# For RHEL/CentOS with EPEL repository
sudo yum install epel-release
sudo yum install cbm

# For Fedora
sudo dnf install cbm
Arch Linux
sudo pacman -S cbmCompiling from Source
If cbm isn’t available in your distribution’s repository, you can compile it from source:
wget http://www.isotton.com/utils/cbm/cbm-0.1.tar.gz
tar -xzf cbm-0.1.tar.gz
cd cbm-0.1
make
sudo make install
Basic cbm Syntax
The basic syntax for the cbm command is:
cbm [options] [interface]Common Options
| Option | Description |
|---|---|
-r seconds |
Set refresh rate in seconds |
-a |
Show all interfaces |
-u |
Display units (KB/s, MB/s, etc.) |
-c |
Use colors in output |
-h |
Display help information |
Practical Examples
Example 1: Basic Usage
Monitor bandwidth on the default network interface:
cbmExpected Output:
Interface: eth0
    RX:    1.2 MB/s ████████████
    TX:  512.3 KB/s ████████
Total RX: 156.7 MB
Total TX:  89.2 MB
Uptime: 2h 15m 30s
Example 2: Monitor Specific Interface
Monitor bandwidth on a specific network interface (e.g., wlan0 for wireless):
cbm wlan0Expected Output:
Interface: wlan0
    RX:  856.4 KB/s ██████████
    TX:  234.1 KB/s ████
Total RX:  89.3 MB
Total TX:  45.7 MB
Uptime: 1h 42m 18s
Example 3: Monitor All Interfaces
Display bandwidth statistics for all available network interfaces:
cbm -aExpected Output:
Interface: eth0
    RX:    2.1 MB/s ████████████████
    TX:  768.9 KB/s ██████████

Interface: wlan0
    RX:    0.0  B/s
    TX:    0.0  B/s

Interface: lo
    RX:   45.2 KB/s ██
    TX:   45.2 KB/s ██
Example 4: Custom Refresh Rate
Set a custom refresh rate of 5 seconds:
cbm -r 5 eth0This command updates the display every 5 seconds instead of the default 1 second interval.
Example 5: Display with Units
Show bandwidth with explicit units:
cbm -u -c eth0Expected Output:
Interface: eth0 [Color Mode]
    RX:    1.47 MB/s ████████████████ (Megabytes per second)
    TX:  623.81 KB/s ██████████       (Kilobytes per second)
Total RX: 234.56 MB
Total TX: 156.78 MB
Peak RX:   2.34 MB/s
Peak TX:   1.12 MB/s
Advanced Usage Scenarios
Monitoring Multiple Interfaces Simultaneously
You can run multiple cbm instances in different terminal windows to monitor various interfaces:
# Terminal 1 - Monitor ethernet
cbm -c eth0

# Terminal 2 - Monitor wireless
cbm -c wlan0

# Terminal 3 - Monitor all interfaces
cbm -a -r 2
Logging Bandwidth Data
While cbm doesn’t have built-in logging, you can combine it with other commands for data collection:
# Redirect output to a log file
cbm eth0 | tee bandwidth.log

# Create timestamped logs
while true; do
    echo "$(date): $(cbm -a | head -n 5)" >> daily_bandwidth.log
    sleep 60
done
Understanding cbm Output
Color Coding
When using the -c option, cbm displays different colors for various metrics:
- Green: Normal bandwidth usage
- Yellow: Medium traffic load
- Red: High bandwidth utilization
- Blue: Download traffic (RX)
- Magenta: Upload traffic (TX)
Graph Interpretation
The horizontal bars represent relative bandwidth usage:
- Bar length: Proportional to current bandwidth usage
- Real-time updates: Bars change dynamically based on network activity
- Scale adjustment: Automatically adjusts to show meaningful comparisons
Troubleshooting Common Issues
Permission Errors
If you encounter permission errors, run cbm with sudo:
sudo cbm eth0Interface Not Found
List available network interfaces first:
# List all network interfaces
ip link show

# Or use the traditional command
ifconfig -a

# Then use cbm with the correct interface name
cbm enp0s3
No Data Displayed
If cbm shows no data, check if the interface is active:
# Check interface status
ip addr show eth0

# Ensure interface is up
sudo ip link set eth0 up
Alternatives to cbm
While cbm is excellent for colorful bandwidth monitoring, consider these alternatives:
- iftop: Interactive bandwidth usage monitor
- nload: Console application for monitoring network traffic
- vnstat: Network statistics utility
- bmon: Bandwidth monitor and rate estimator
- nethogs: Process-specific network usage monitor
Best Practices
Monitoring Strategy
- Regular monitoring: Check bandwidth usage during different times of day
- Interface selection: Monitor the primary active interface
- Baseline establishment: Understand normal usage patterns
- Alert thresholds: Know when bandwidth usage becomes concerning
Performance Considerations
- Refresh rate: Balance between real-time updates and system load
- Multiple instances: Avoid running too many cbm instances simultaneously
- Resource usage: Monitor cbm’s own impact on system performance
Integration with System Monitoring
CBM can be integrated into broader system monitoring workflows:
Scripting with cbm
#!/bin/bash
# Simple bandwidth monitoring script

INTERFACE="eth0"
LOG_FILE="/var/log/bandwidth.log"

while true; do
    TIMESTAMP=$(date "+%Y-%m-%d %H:%M:%S")
    STATS=$(cbm $INTERFACE | head -n 3)
    echo "$TIMESTAMP - $STATS" >> $LOG_FILE
    sleep 300  # Log every 5 minutes
done
Combining with System Alerts
#!/bin/bash
# Alert script for high bandwidth usage

THRESHOLD=1000000  # 1 MB/s in bytes
CURRENT_RX=$(cat /sys/class/net/eth0/statistics/rx_bytes)
sleep 1
NEW_RX=$(cat /sys/class/net/eth0/statistics/rx_bytes)
RATE=$((NEW_RX - CURRENT_RX))

if [ $RATE -gt $THRESHOLD ]; then
    echo "High bandwidth usage detected: $RATE bytes/s"
    # Send alert or notification
fi
Conclusion
The cbm command is an invaluable tool for Linux system administrators and users who need to monitor network bandwidth usage with a visual, colorful interface. Its real-time monitoring capabilities, combined with customizable display options, make it an excellent choice for understanding network traffic patterns and identifying performance issues.
Whether you’re troubleshooting network problems, monitoring server performance, or simply keeping track of your system’s bandwidth usage, cbm provides the visual feedback needed to make informed decisions about network management. By mastering its various options and understanding how to interpret its output, you can effectively monitor and optimize your network performance.
Remember to combine cbm with other monitoring tools and scripts to create a comprehensive network monitoring solution that meets your specific requirements. Regular monitoring and understanding of your network’s baseline performance will help you quickly identify and address any bandwidth-related issues that may arise.
Related Posts
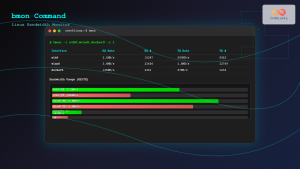
bmon Command Linux: Complete Guide to Real-Time Bandwidth Monitoring and Network Analysis
The bmon (Bandwidth Monitor) command is a powerful Linux utility designed for real-time network bandwidth monitoring and rate estimation. This...
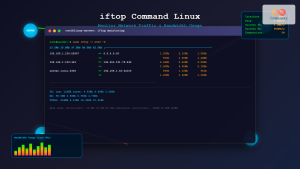
iftop Command Linux: Monitor Network Traffic and Display Bandwidth Usage by Connection
The iftop command is a powerful network monitoring tool in Linux that displays real-time bandwidth usage by network connections. Similar...
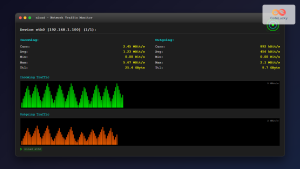
nload Command Linux: Complete Guide to Monitor Network Traffic and Bandwidth in Real-Time
The nload command is a powerful Linux utility that provides real-time monitoring of network traffic and bandwidth usage. Unlike basic...

iptraf Command Linux: Complete Interactive Network Monitoring Guide
The iptraf command is a powerful console-based network monitoring utility for Linux systems that provides real-time IP LAN monitoring capabilities....
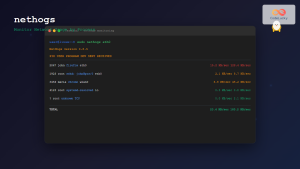
nethogs Command Linux: Monitor Real-Time Network Usage by Process
Network monitoring is a crucial aspect of system administration, especially when you need to identify which processes are consuming bandwidth...
slurm Command Linux: Real-Time Network Traffic Monitor and Bandwidth Analyzer
The slurm command is a powerful network monitoring tool for Linux systems that provides real-time visualization of network traffic and...
nethogs Advanced Linux: Complete Guide to Per-Process Network Monitoring
Network monitoring is crucial for system administrators and developers who need to track bandwidth usage and identify network-intensive processes. While...
ntopng Command Linux: Complete Guide to Web-Based Network Traffic Monitoring
Network traffic monitoring is crucial for maintaining optimal network performance, security, and troubleshooting connectivity issues. The ntopng command provides a...
jnettop Command Linux: Monitor Real-Time Network Traffic by Connection
The jnettop command is a powerful Linux network monitoring tool that provides real-time visibility into network traffic organized by individual...
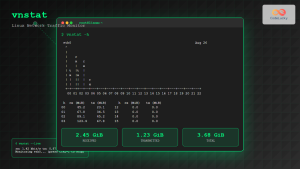
vnstat Command Linux: Complete Network Traffic Monitoring Guide
Network traffic monitoring is a crucial aspect of system administration, and the vnstat command in Linux provides an elegant solution...
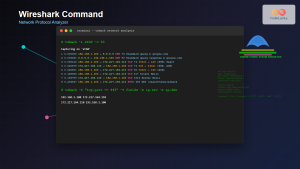
Wireshark Command Linux: Complete Network Protocol Analyzer Guide
Wireshark is the world's most popular network protocol analyzer, providing deep visibility into network traffic and communication protocols. While most...
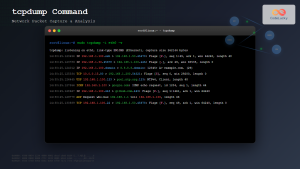
tcpdump Command Linux: Complete Guide to Network Packet Capture and Analysis
The tcpdump command is one of the most powerful network analysis tools available in Linux systems. It allows system administrators...


