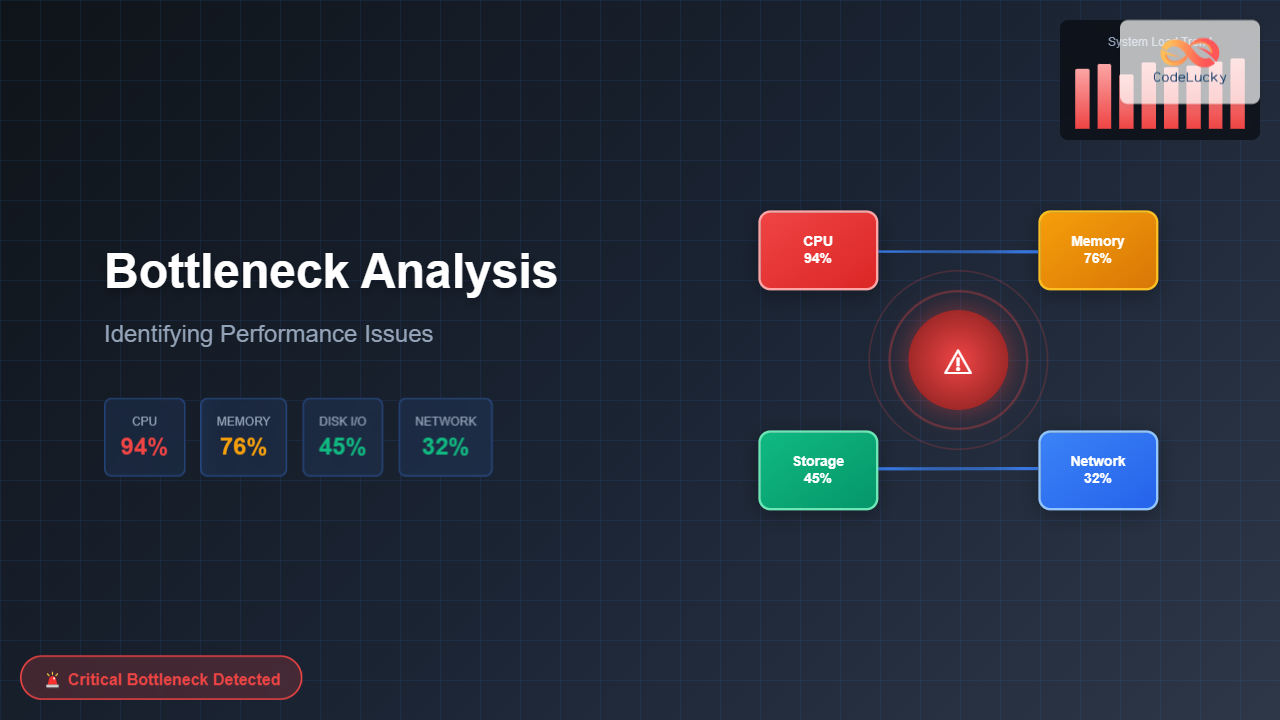
System performance bottlenecks are the primary culprits behind sluggish applications, frustrated users, and inefficient resource utilization. Understanding how to identify and analyze these performance constraints is crucial for maintaining optimal system health and ensuring smooth operations.
Understanding Performance Bottlenecks
A bottleneck occurs when one system component limits the overall performance of the entire system, creating a constraint that prevents other resources from operating at their full potential. Think of it like a highway where multiple lanes suddenly merge into a single lane – traffic flow becomes limited by that narrow section regardless of how many lanes existed before.
Types of System Bottlenecks
CPU Bottlenecks
CPU bottlenecks manifest when processor utilization consistently exceeds 80-90%, causing tasks to queue for processing time. This typically results in high response times and reduced system throughput.
Common indicators:
- High CPU utilization (>85% sustained)
- Increasing process queue length
- Context switching overhead
- Thread contention and waiting states
Memory Bottlenecks
Memory constraints occur when available RAM becomes insufficient for current workloads, forcing the system to rely heavily on virtual memory and swap space.
Key symptoms:
- High memory utilization (>90%)
- Excessive page faults
- Swap file activity
- Memory allocation failures
Disk I/O Bottlenecks
Storage bottlenecks emerge when disk read/write operations cannot keep pace with application demands, creating delays in data access and persistence operations.
Identifying characteristics:
- High disk queue lengths
- Extended disk response times
- Low disk throughput relative to capacity
- I/O wait time spikes
Network Bottlenecks
Network constraints limit data transfer capabilities between systems, affecting distributed applications and remote resource access.
Observable signs:
- High network utilization
- Packet loss and retransmissions
- Increased latency
- Connection timeouts
Bottleneck Detection Methodology
Performance Monitoring Tools
Windows Environment
Performance Monitor (PerfMon) provides comprehensive system metrics collection and analysis capabilities.
// Key Windows performance counters
Processor(_Total)\% Processor Time
Memory\Available MBytes
PhysicalDisk(_Total)\% Disk Time
Network Interface(*)\Bytes Total/sec
Process(*)\Working Set
System\Processor Queue Length
Linux Environment
Essential Linux monitoring commands:
# CPU monitoring
top -p [PID]
htop
sar -u 1 5

# Memory analysis
free -h
cat /proc/meminfo
vmstat 1 5

# Disk I/O monitoring
iostat -x 1 5
iotop
df -h

# Network monitoring
netstat -i
iftop
ss -tuln
Practical Bottleneck Analysis Examples
Example 1: CPU Bottleneck Analysis
Consider a web application experiencing slow response times during peak traffic hours.
# Linux CPU analysis
$ top
Tasks: 150 total, 8 running, 142 sleeping
%Cpu(s): 89.2 us, 8.1 sy, 0.0 ni, 2.1 id, 0.6 wa

PID    USER    %CPU  %MEM  COMMAND
1234   webapp  45.2  12.3  java
5678   webapp  32.1   8.7  java
9012   webapp  28.9  10.1  java

$ sar -u 1 5
Average: %user %nice %system %iowait %idle
         87.4   0.0    9.8     1.2    1.6
Analysis: CPU utilization consistently above 85% with minimal idle time indicates a CPU bottleneck. The high user-space utilization suggests application-level processing constraints.
Example 2: Memory Bottleneck Detection
# Memory analysis output
$ free -h
total used free shared buff/cache available
Mem: 8.0G 7.2G 128M 245M 656M 312M
Swap: 2.0G 1.8G 200M
$ vmstat 1 5
procs -----------memory---------- ---swap-- -----io---- -system-- ------cpu-----
r b swpd free buff cache si so bi bo in cs us sy id wa st
3 2 1843200 131072 67584 589824 245 189 89 156 234 445 78 12 8 2 0
Analysis: Available memory critically low (312M), active swap usage (1.8G), and significant swap in/out activity indicate memory pressure requiring immediate attention.
Example 3: Disk I/O Bottleneck Investigation
# Disk I/O performance analysis
$ iostat -x 1 5
Device r/s w/s rkB/s wkB/s avgrq-sz avgqu-sz await svctm %util
sda 89.2 156.7 2847 6234 74.3 8.45 34.2 4.1 89.7
sdb 12.1 23.4 456 987 41.2 0.89 7.8 2.3 8.1
$ iotop
Total DISK READ: 2.85M/s | Total DISK WRITE: 6.23M/s
PID PRIO USER DISK READ DISK WRITE SWAPIN IO COMMAND
1234 be/4 mysql 1.23M/s 4.56M/s 0.00% 78.90% mysqld
5678 be/4 webapp 892K/s 1.67M/s 0.00% 34.20% java
Analysis: Device sda shows high utilization (89.7%), elevated queue depth (8.45), and increased service time (34.2ms), indicating I/O bottleneck primarily from database operations.
Advanced Bottleneck Analysis Techniques
Application Performance Profiling

Java Application Profiling:
// JVM profiling parameters
-XX:+UnlockCommercialFeatures
-XX:+FlightRecorder
-XX:StartFlightRecording=duration=60s,filename=profile.jfr
// Memory analysis
-XX:+PrintGCDetails
-XX:+PrintGCTimeStamps
-Xloggc:gc.log
// Thread dump analysis
jstack [PID] > thread_dump.txt
jmap -histo [PID] > heap_histogram.txt
Database Performance Analysis
Database bottlenecks often stem from inefficient queries, inadequate indexing, or resource contention.
-- SQL Server performance analysis
SELECT
req.session_id,
req.total_elapsed_time,
req.cpu_time,
req.logical_reads,
req.writes,
req.wait_type,
text.text AS query_text
FROM sys.dm_exec_requests req
CROSS APPLY sys.dm_exec_sql_text(req.sql_handle) text
WHERE req.session_id > 50
ORDER BY req.total_elapsed_time DESC;
Bottleneck Resolution Strategies
CPU Optimization
- Code optimization: Eliminate inefficient algorithms and reduce computational complexity
- Concurrency improvements: Implement proper threading and parallel processing
- Hardware scaling: Upgrade CPU or add additional processing cores
- Load distribution: Implement load balancing across multiple servers
Memory Optimization
- Memory leak detection: Identify and fix memory leaks in applications
- Caching strategies: Implement intelligent caching to reduce memory pressure
- RAM upgrades: Increase physical memory capacity
- Virtual memory tuning: Optimize swap file configuration
Storage Performance Enhancement
- SSD migration: Replace traditional HDDs with solid-state drives
- RAID configuration: Implement appropriate RAID levels for performance
- I/O scheduling: Optimize disk scheduling algorithms
- Database optimization: Tune queries and implement proper indexing
Network Optimization
- Bandwidth upgrades: Increase network capacity
- Protocol optimization: Use efficient communication protocols
- Data compression: Reduce payload sizes
- CDN implementation: Distribute content geographically
Automated Monitoring and Alerting

Monitoring Configuration Example
# Prometheus monitoring rules
groups:
- name: system_bottlenecks
rules:
- alert: HighCPUUsage
expr: cpu_usage_percent > 85
for: 5m
labels:
severity: warning
annotations:
summary: "High CPU usage detected"
- alert: HighMemoryUsage
expr: memory_usage_percent > 90
for: 2m
labels:
severity: critical
annotations:
summary: "Critical memory usage"
- alert: HighDiskIO
expr: disk_io_util_percent > 80
for: 3m
labels:
severity: warning
annotations:
summary: "High disk I/O utilization"
Performance Testing and Validation
Load testing approach:
# JMeter load testing script
ThreadGroup:
- Number of Threads: 100
- Ramp-up Period: 60s
- Loop Count: 500
HTTP Request:
- Server Name: webapp.example.com
- Path: /api/endpoint
- Method: POST
Assertions:
- Response Time: < 2000ms
- Response Code: 200
Listeners:
- Aggregate Report
- Response Times Over Time
- Active Threads Over Time
Best Practices for Bottleneck Prevention
- Proactive monitoring: Establish comprehensive monitoring before issues occur
- Capacity planning: Project future resource requirements based on growth trends
- Regular performance reviews: Conduct periodic system performance assessments
- Documentation: Maintain detailed records of performance baselines and optimizations
- Testing procedures: Implement regular load testing in development cycles
- Automated scaling: Configure auto-scaling based on performance metrics
- Team training: Ensure team members understand performance analysis techniques
Conclusion
Effective bottleneck analysis requires a systematic approach combining the right tools, methodologies, and expertise. By establishing proper monitoring, understanding system behavior patterns, and implementing proactive optimization strategies, organizations can maintain optimal system performance and prevent costly performance degradations.
Remember that bottleneck analysis is an ongoing process rather than a one-time activity. As systems evolve and workloads change, new performance constraints may emerge, requiring continuous vigilance and adaptation of monitoring and optimization strategies.

The investment in comprehensive performance analysis capabilities pays dividends through improved user experience, reduced operational costs, and enhanced system reliability. Start implementing these techniques today to build more resilient and performant systems.

