
The bmon (Bandwidth Monitor) command is a powerful Linux utility designed for real-time network bandwidth monitoring and rate estimation. This comprehensive tool provides system administrators and network engineers with detailed insights into network interface statistics, traffic patterns, and bandwidth utilization across multiple network interfaces simultaneously.
What is bmon Command?
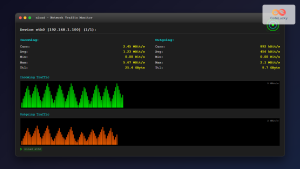
bmon stands for Bandwidth Monitor and serves as an interactive console-based network monitoring tool. It displays real-time statistics for network interfaces, including incoming and outgoing traffic rates, packet counts, error statistics, and historical data visualization through ASCII graphs.
Key features of bmon include:
- Real-time bandwidth monitoring for all network interfaces
- Interactive terminal-based interface with color coding
- Historical data visualization through ASCII graphs
- Support for multiple output formats and modules
- Configurable update intervals and display options
- Network interface filtering and selection capabilities
Installing bmon on Linux
Installation methods vary depending on your Linux distribution:
Ubuntu/Debian Systems
sudo apt update
sudo apt install bmon
CentOS/RHEL/Fedora Systems
# For Fedora
sudo dnf install bmon

# For CentOS/RHEL (Enable EPEL repository first)
sudo yum install epel-release
sudo yum install bmon
Arch Linux
sudo pacman -S bmonBasic bmon Command Syntax
The basic syntax for the bmon command is:
bmon [OPTIONS] [INTERFACES]Where:
OPTIONS– Various command-line flags and parametersINTERFACES– Specific network interfaces to monitor (optional)
Essential bmon Command Options
| Option | Description |
|---|---|
-p |
Use policy for interface selection |
-i |
Specify interfaces to monitor |
-r |
Set refresh interval in seconds |
-o |
Set output module |
-U |
Show bytes in specified units |
-R |
Show rates in specified units |
-f |
Read configuration from file |
Practical bmon Examples
Basic Network Monitoring
Start bmon with default settings to monitor all available network interfaces:
bmonSample Output:
qdisc wan0 root refcnt=2 handle 1: htb default 30
 Qdisc htb 1: root refcnt=2 r2q 10 default 30 direct_packets_stat 0

Interface                   RX Rate      RX #     TX Rate      TX #
lo                          0.00B/s         0      0.00B/s        0
eth0                       45.2KB/s      1247     12.8KB/s      892
wlan0                       2.1MB/s      3421      890KB/s     2156
docker0                     0.00B/s         0      0.00B/s        0
Monitor Specific Interface
Monitor only a specific network interface like eth0:
bmon -i eth0This command focuses monitoring on the specified interface, providing detailed statistics and historical graphs.
Set Custom Refresh Interval
Configure bmon to update every 2 seconds instead of the default:
bmon -r 2This increases the monitoring frequency, useful for observing rapid network changes.
Monitor Multiple Specific Interfaces
Monitor multiple interfaces simultaneously:
bmon -i eth0,wlan0,docker0Expected Output:
                             (RX Bytes/second)
eth0         ||||||||||||||||                                    856KB/s
wlan0        ||||||||||||||||||||||||||||||||||||||||||||||||||  2.1MB/s
docker0      |                                                   1.2KB/s

                             (TX Bytes/second)
eth0         ||||||||||||||                                      445KB/s
wlan0        ||||||||||||||||||||||||||||||||||||                1.8MB/s
docker0      |                                                   890B/s
Advanced bmon Usage
Using Different Output Modules
bmon supports various output modules for different display formats:
# ASCII output module
bmon -o ascii

# Curses-based interface (default)
bmon -o curses

# Format output for parsing
bmon -o format
Customizing Units Display
Control how bandwidth and rates are displayed:
# Display bytes in kilobytes
bmon -U k

# Display rates in megabits per second
bmon -R Mbit

# Combine both options
bmon -U M -R Mbit
Interface Selection Policies
Use policies to automatically select interfaces:
# Monitor all interfaces except loopback
bmon -p eth*,wlan*

# Monitor only physical ethernet interfaces
bmon -p eth*
Interactive Controls in bmon
When running bmon interactively, several keyboard shortcuts enhance functionality:
| Key | Function |
|---|---|
q |
Quit bmon |
d |
Toggle detailed view |
g |
Toggle graphical display |
l |
Toggle list view |
Up/Down |
Navigate between interfaces |
Left/Right |
Adjust time scale |
Configuration File Usage
Create a configuration file for persistent bmon settings:
# Create bmon configuration file
nano ~/.bmonrc
Sample Configuration:
interface {
    policy eth*,wlan*
    hide-policy lo,docker*
}

output {
    module curses
    unit bytes
    rate-unit bits
}

timing {
    read-interval 1.0
    lifetime 60
}
Use the configuration file:
bmon -f ~/.bmonrcReal-World Use Cases
Network Troubleshooting
Monitor network performance during troubleshooting:
# Monitor primary interface with 1-second updates
bmon -i eth0 -r 1
This provides real-time visibility into network traffic patterns, helping identify bandwidth bottlenecks or unusual traffic spikes.
Server Performance Monitoring
For server environments, monitor all network interfaces:
# Monitor all interfaces with ASCII output for logging
bmon -o ascii -p eth*,bond* > network_stats.log
Wireless Network Analysis
Focus on wireless interface monitoring:
bmon -i wlan0 -U M -R MbitThis configuration displays wireless traffic in megabytes and rates in megabits per second, ideal for wireless network analysis.
Understanding bmon Output
Statistical Information
bmon displays various network statistics:
- RX Rate/TX Rate: Current receive/transmit rates
- RX #/TX #: Total packet counts
- Errors: Network error counters
- Drops: Dropped packet statistics
Graphical Representation
The ASCII graphs show:
- Historical bandwidth usage over time
- Peak usage indicators
- Traffic pattern visualization
- Comparative interface performance
Best Practices and Tips
Performance Considerations
- Use appropriate refresh intervals to balance accuracy with system load
- Filter interfaces when monitoring high-traffic systems
- Consider output redirection for automated monitoring
- Use configuration files for consistent monitoring setups
Monitoring Strategies
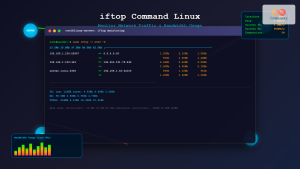
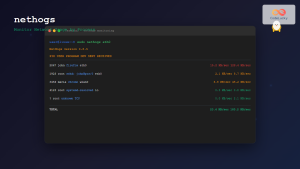
- Combine bmon with other tools like
iftopandnethogsfor comprehensive analysis - Use different time scales to identify both immediate and long-term trends
- Implement automated alerting based on bmon output
- Regular monitoring helps establish baseline network performance
Common Issues and Solutions
Permission Issues
If bmon cannot access network interface statistics:
# Run with appropriate privileges
sudo bmon
Interface Not Found
List available interfaces first:
# Check available interfaces
ip link show

# Then monitor specific interface
bmon -i interface_name
Integration with System Monitoring
Scripting with bmon
Create automated monitoring scripts:
#!/bin/bash
# Network monitoring script
echo "Starting network monitoring at $(date)"
bmon -o ascii -r 5 -i eth0 | while read line; do
    echo "$(date): $line" >> /var/log/network-monitor.log
done
Combining with Other Tools
Use bmon alongside other monitoring utilities:
# Terminal multiplexer for comprehensive monitoring
tmux new-session -d 'bmon'
tmux split-window -v 'htop'
tmux split-window -h 'iotop'
tmux attach
Conclusion
The bmon command is an essential tool for Linux system administrators and network engineers requiring real-time bandwidth monitoring and network analysis. Its interactive interface, comprehensive statistics, and flexible configuration options make it invaluable for troubleshooting network issues, monitoring server performance, and analyzing traffic patterns.
By mastering bmon’s various options and features, you can gain deep insights into your network infrastructure’s performance and quickly identify potential issues before they impact system performance. Regular use of bmon as part of your monitoring toolkit will enhance your ability to maintain optimal network performance and troubleshoot connectivity problems effectively.
Whether you’re monitoring a single server or managing a complex network infrastructure, bmon provides the real-time visibility needed to make informed decisions about network performance and capacity planning.
Related Posts

cbm Command Linux: Monitor Network Bandwidth in Real-Time with Color Display
The cbm (Color Bandwidth Meter) command is a powerful Linux utility that provides real-time monitoring of network bandwidth usage with...
nload Command Linux: Complete Guide to Monitor Network Traffic and Bandwidth in Real-Time
The nload command is a powerful Linux utility that provides real-time monitoring of network traffic and bandwidth usage. Unlike basic...

iptraf Command Linux: Complete Interactive Network Monitoring Guide
The iptraf command is a powerful console-based network monitoring utility for Linux systems that provides real-time IP LAN monitoring capabilities....
iftop Command Linux: Monitor Network Traffic and Display Bandwidth Usage by Connection
The iftop command is a powerful network monitoring tool in Linux that displays real-time bandwidth usage by network connections. Similar...
nethogs Command Linux: Monitor Real-Time Network Usage by Process
Network monitoring is a crucial aspect of system administration, especially when you need to identify which processes are consuming bandwidth...
jnettop Command Linux: Monitor Real-Time Network Traffic by Connection
The jnettop command is a powerful Linux network monitoring tool that provides real-time visibility into network traffic organized by individual...
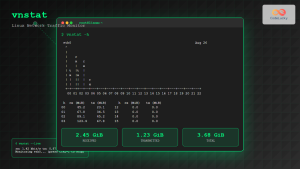
vnstat Command Linux: Complete Network Traffic Monitoring Guide
Network traffic monitoring is a crucial aspect of system administration, and the vnstat command in Linux provides an elegant solution...
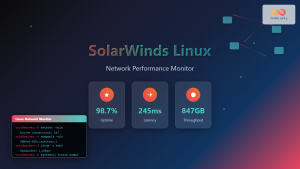
SolarWinds Linux: Complete Network Performance Monitor Guide for System Administrators
SolarWinds Network Performance Monitor (NPM) is a powerful network monitoring solution that provides comprehensive visibility into network infrastructure performance. While...
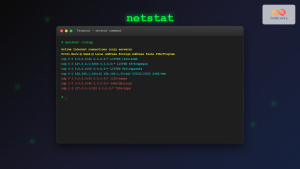
netstat Command Linux: Complete Guide to Network Connection Monitoring
The netstat command is one of the most essential network monitoring tools in Linux systems. It provides comprehensive information about...
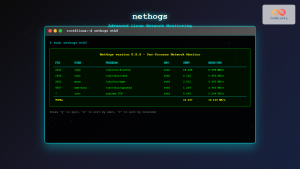
nethogs Advanced Linux: Complete Guide to Per-Process Network Monitoring
Network monitoring is crucial for system administrators and developers who need to track bandwidth usage and identify network-intensive processes. While...
ntopng Command Linux: Complete Guide to Web-Based Network Traffic Monitoring
Network traffic monitoring is crucial for maintaining optimal network performance, security, and troubleshooting connectivity issues. The ntopng command provides a...
slurm Command Linux: Real-Time Network Traffic Monitor and Bandwidth Analyzer
The slurm command is a powerful network monitoring tool for Linux systems that provides real-time visualization of network traffic and...


