Telegraf is a powerful, plugin-driven server agent for collecting and reporting metrics from databases, systems, and IoT sensors. As part of the TICK stack (Telegraf, InfluxDB, Chronograf, Kapacitor), Telegraf serves as the data collection component that gathers metrics from various sources and forwards them to different outputs like InfluxDB, Elasticsearch, or cloud monitoring services.
What is Telegraf?
Telegraf is an open-source agent written in Go that collects metrics and data on the system it’s running on or from remote services. It’s designed to be lightweight, fast, and highly configurable with minimal memory footprint. The agent supports over 300 plugins for input, output, processor, and aggregator functions.
Key Features of Telegraf
- Plugin Architecture: Extensive plugin ecosystem for various data sources and outputs
- Low Resource Usage: Minimal CPU and memory consumption
- Configuration Flexibility: TOML-based configuration files
- Multiple Output Support: Send data to multiple destinations simultaneously
- Built-in Processing: Data transformation and aggregation capabilities
Installing Telegraf on Linux
Installation via Package Manager
The easiest way to install Telegraf is through your distribution’s package manager.
Ubuntu/Debian Installation
# Add InfluxData repository
curl -sL https://repos.influxdata.com/influxdb.key | sudo apt-key add -
echo "deb https://repos.influxdata.com/ubuntu $(lsb_release -cs) stable" | sudo tee /etc/apt/sources.list.d/influxdb.list

# Update package list and install
sudo apt update
sudo apt install telegraf
CentOS/RHEL/Fedora Installation
# Add InfluxData repository
cat <<EOF | sudo tee /etc/yum.repos.d/influxdb.repo
[influxdb]
name = InfluxDB Repository - RHEL
baseurl = https://repos.influxdata.com/rhel/8/x86_64/stable/
enabled = 1
gpgcheck = 1
gpgkey = https://repos.influxdata.com/influxdb.key
EOF

# Install Telegraf
sudo yum install telegraf
Installation from Binary
# Download the latest release
wget https://dl.influxdata.com/telegraf/releases/telegraf-1.27.4_linux_amd64.tar.gz

# Extract and install
tar -xzf telegraf-1.27.4_linux_amd64.tar.gz
sudo cp telegraf-1.27.4/usr/bin/telegraf /usr/local/bin/
sudo chmod +x /usr/local/bin/telegraf
Basic Telegraf Configuration
Telegraf uses TOML (Tom’s Obvious, Minimal Language) configuration files. The main configuration file is typically located at /etc/telegraf/telegraf.conf.
Generating Initial Configuration
# Generate a sample configuration file
telegraf config > telegraf.conf

# Generate configuration with specific inputs and outputs
telegraf config --input-filter cpu:mem --output-filter influxdb > telegraf.conf
Basic Configuration Structure
# Global settings
[global_tags]
  # Global tags applied to all metrics
  datacenter = "us-west-1"
  host = "server01"

[agent]
  # Collection interval
  interval = "10s"
  # Precision of timestamps
  precision = "s"
  # Debug mode
  debug = false

# Output configuration
[[outputs.influxdb]]
  urls = ["http://localhost:8086"]
  database = "telegraf"
  username = "telegraf"
  password = "mypassword"

# Input configuration
[[inputs.cpu]]
  percpu = true
  totalcpu = true

[[inputs.disk]]
  ignore_fs = ["tmpfs", "devtmpfs", "devfs"]

[[inputs.mem]]
Essential Input Plugins
System Metrics Collection
CPU Metrics
[[inputs.cpu]]
  # Collect per-CPU stats
  percpu = true
  # Collect total CPU stats
  totalcpu = true
  # Fields to collect
  collect_cpu_time = false
  # Report active time instead of idle time
  report_active = false
Memory Metrics
[[inputs.mem]]
  # No additional configuration needed for basic memory stats
Disk Metrics
[[inputs.disk]]
  # Mount points to ignore
  ignore_fs = ["tmpfs", "devtmpfs", "devfs", "overlay", "aufs", "squashfs"]
  # Mount points to include (optional)
  # mount_points = ["/", "/home"]
Network Metrics
[[inputs.net]]
  # Network interfaces to collect
  # interfaces = ["eth0", "wlan0"]
Process Monitoring
[[inputs.processes]]
  # No configuration needed for basic process stats

[[inputs.procstat]]
  # Monitor specific processes by name
  pattern = "nginx"
  # Or by PID file
  # pid_file = "/var/run/nginx.pid"
Running Telegraf
Service Management
# Enable and start Telegraf service
sudo systemctl enable telegraf
sudo systemctl start telegraf

# Check service status
sudo systemctl status telegraf

# View logs
sudo journalctl -u telegraf -f
Manual Execution
# Run Telegraf with custom config
telegraf --config /path/to/telegraf.conf

# Test configuration without running
telegraf --config /etc/telegraf/telegraf.conf --test

# Debug mode
telegraf --config /etc/telegraf/telegraf.conf --debug
Output Plugins Configuration
InfluxDB Output
[[outputs.influxdb]]
  urls = ["http://localhost:8086"]
  database = "telegraf"
  retention_policy = ""
  write_consistency = "any"
  timeout = "5s"
  username = "telegraf"
  password = "mypassword"
Elasticsearch Output
[[outputs.elasticsearch]]
  urls = ["http://localhost:9200"]
  index_name = "telegraf-%Y.%m.%d"
  timeout = "5s"
  health_check_interval = "10s"
File Output
[[outputs.file]]
  files = ["stdout", "/tmp/metrics.out"]
  data_format = "influx"
Advanced Configuration Examples
Docker Container Monitoring
[[inputs.docker]]
  endpoint = "unix:///var/run/docker.sock"
  gather_services = false
  container_name_include = []
  container_name_exclude = []
  timeout = "5s"
  perdevice = true
  total = false
MySQL Database Monitoring
[[inputs.mysql]]
  servers = ["user:password@tcp(localhost:3306)/"]
  perf_events_statements_digest_text_limit = 120
  perf_events_statements_limit = 250
  perf_events_statements_time_limit = 86400
  table_schema_databases = []
  gather_table_schema = false
  gather_process_list = true
  gather_user_statistics = true
  gather_info_schema_auto_inc = true
  gather_innodb_metrics = true
  gather_slave_status = true
  gather_binary_logs = false
  gather_table_io_waits = false
  gather_table_lock_waits = false
  gather_index_io_waits = false
  gather_event_waits = false
  gather_file_events_stats = false
  interval_slow = "30m"
Web Service Monitoring
[[inputs.http_response]]
  urls = [
    "http://example.com",
    "https://api.example.com/health"
  ]
  response_timeout = "5s"
  method = "GET"
  follow_redirects = true
Data Processing and Filtering
Processor Plugins
# Add calculated fields
[[processors.converter]]
  [processors.converter.fields]
    measurement = ["cpu_usage_idle", "cpu_usage_busy"]

# Rename fields
[[processors.rename]]
  [[processors.rename.replace]]
    field = "usage_idle"
    dest = "cpu_idle_percent"
Filtering Data
# Filter by tags
[[inputs.cpu]]
  percpu = true
  totalcpu = true
  [inputs.cpu.tagdrop]
    cpu = ["cpu6", "cpu7"]

# Filter by fields
[[inputs.mem]]
  [inputs.mem.fielddrop]
    fields = ["commit_limit", "committed_as"]
Monitoring Telegraf Performance
Internal Metrics
[[inputs.internal]]
  collect_memstats = true
Health Checks
# Check Telegraf version
telegraf version

# Verify configuration syntax
telegraf --config /etc/telegraf/telegraf.conf --test

# Check plugin availability
telegraf --usage mem

# Monitor resource usage
ps aux | grep telegraf
top -p $(pgrep telegraf)
Troubleshooting Common Issues
Configuration Validation
# Test configuration file
telegraf --config telegraf.conf --test --verbose

# Check for configuration errors
sudo journalctl -u telegraf --no-pager | grep -i error
Connection Issues
# Test connectivity to outputs
telegraf --config telegraf.conf --test --debug

# Check network connectivity
telnet your-influxdb-host 8086
curl -I http://your-influxdb-host:8086/ping
Permission Issues
# Ensure Telegraf user has necessary permissions
sudo usermod -a -G docker telegraf
sudo usermod -a -G adm telegraf

# Restart service after permission changes
sudo systemctl restart telegraf
Best Practices
Configuration Management
- Use Environment Variables: Store sensitive information like passwords in environment variables
- Modular Configuration: Split configuration into multiple files using the config-directory option
- Version Control: Keep configuration files in version control
- Regular Backups: Backup configuration files regularly
Performance Optimization
[agent]
  interval = "60s"        # Adjust collection interval
  flush_interval = "10s"  # Adjust output frequency
  metric_batch_size = 1000
  metric_buffer_limit = 10000
Security Considerations
- User Permissions: Run Telegraf with minimal required permissions
- Network Security: Use TLS/SSL for data transmission
- Authentication: Implement proper authentication for outputs
- Access Control: Restrict access to configuration files
Integration with Monitoring Stacks
TICK Stack Integration
# Complete TICK stack setup
# 1. Install InfluxDB
sudo apt install influxdb

# 2. Install Chronograf
sudo apt install chronograf

# 3. Install Kapacitor
sudo apt install kapacitor

# 4. Configure Telegraf to send data to InfluxDB
# (Configuration shown in previous sections)
Prometheus Integration
[[outputs.prometheus_client]]
  listen = ":9273"
  metric_version = 2
  collectors_exclude = ["gocollector", "process"]
Conclusion
Telegraf is an essential tool for modern infrastructure monitoring, providing comprehensive metrics collection with minimal overhead. Its plugin-driven architecture makes it highly flexible and adaptable to various monitoring needs. By following the installation, configuration, and best practices outlined in this guide, you can effectively implement Telegraf in your Linux environment to gain valuable insights into system performance and application health.
Regular monitoring of your Telegraf configuration and performance ensures optimal data collection and helps maintain a robust monitoring infrastructure. As your infrastructure grows, Telegraf’s scalability and extensive plugin ecosystem make it an excellent choice for comprehensive metrics collection across diverse environments.
Related Posts
metricbeat Linux: Complete Guide to System and Service Metrics Monitoring
Metricbeat is a lightweight shipper that helps you monitor your systems and services by collecting metrics from the operating system...
grafana Linux: Complete Guide to Analytics and Interactive Visualization Platform
Grafana has revolutionized the way organizations visualize and analyze their data on Linux systems. This powerful open-source analytics and interactive...
InfluxDB Linux: Complete Guide to Time Series Database Installation and Management
InfluxDB is a powerful open-source time series database designed to handle high write and query loads for applications involving time-stamped...
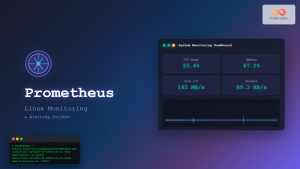
Prometheus Linux: Complete Monitoring and Alerting Toolkit Guide
Prometheus has revolutionized the way we monitor and alert on modern infrastructure. As an open-source monitoring toolkit originally built at...
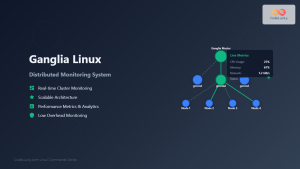
ganglia Linux: Complete Guide to Distributed Monitoring System
Ganglia is a powerful, open-source distributed monitoring system designed specifically for high-performance computing clusters, grids, and cloud infrastructures. Originally developed...
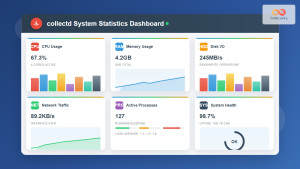
collectd Linux: Complete Guide to System Statistics Collection Daemon
The collectd daemon is a powerful system statistics collection tool for Linux that gathers performance metrics from various system components...
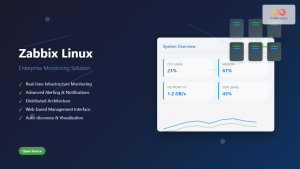
Zabbix Linux: Complete Enterprise Monitoring Solution for System Administrators
Zabbix stands as one of the most powerful and comprehensive open-source monitoring solutions available for Linux environments. This enterprise-grade monitoring...
Sensu Linux: Complete Monitoring Framework Guide for System Administrators
Sensu is a powerful, open-source monitoring framework designed to monitor servers, services, application health, and business KPIs. Built with modern...
Functionbeat Linux: Complete Guide to Serverless Deployment and Monitoring
Functionbeat represents a revolutionary approach to serverless monitoring and data collection in modern cloud environments. As part of the Elastic...
Cacti Advanced Linux: Complete Guide to Enterprise Network Graphing and Monitoring
Cacti stands as one of the most powerful open-source network graphing solutions available for Linux systems, providing comprehensive network monitoring...
Kibana Linux: Complete Guide to Data Visualization Dashboard Setup and Management
Kibana is a powerful open-source data visualization and exploration tool that works seamlessly with Elasticsearch to provide interactive dashboards and...
Beats Linux: Complete Guide to Data Shippers for Elasticsearch Integration
Beats are lightweight, open-source data shippers developed by Elastic that collect different types of data from your systems and forward...